 A guest post by Kim Sinclair, Art Director and CAA Associate
.
I grew up in the Eastern Suburbs, and when young we free-ranged – from building huts in the bamboo bush behind Ladies Bay – to diving off the breakwater at Okahu Bay. My transport was a little orange bike with 24” wheels, and Tamaki Drive was our super-highway!
.
On buying a red Raleigh Royale 10-speed in 1969 my use of the waterfront stepped up a notch. Indeed my first century was done by the simple expedient of spending all day riding up and down Tamaki Drive with a school friend.
.
The 90’s brought the glory days, when the Royal Oak bunch, returning from the Bombay Hills would have a bunch sprint entering St Heliers – sometimes with 50 plus riders.
.
A few years ago I came back to live in Kohimarama, and I added commuting to my recreational use of Tamaki Drive. I have often wondered just how many cyclists use the waterfront from day-to-day?
.
Auckland Transport have of course automated cycle counters. Integrated Traffic Solutions Ltd. (ITS) installed ZELT Inductive Loop Eco-counters to provide automated cycle count data in 2008. The counters survey the eastbound road lanes and the northern shared footpath, situated more or less opposite the Judges Bay. The system has a stated accuracy of from 94–98%. However I have not seen this data publicised. [CAA Note: This data seems to form part of the monthly summary counts published on AT’s website, but currently, the nitty-gritty stats site by site is not accessible to the public, sadly].
.
Secondly a manual count is done, one day, every year by Auckland Transport – published on their website as the 2012 Auckland Regional Manual Cycle Monitor. It has been done in March of every year since 2007 (formerly done by ARTA). Auckland Transport monitors 83 various sites throughout the region, including 10 sites in the Waitemata and Gulf ward. Tamaki Drive returns the highest AADT in the region.
.

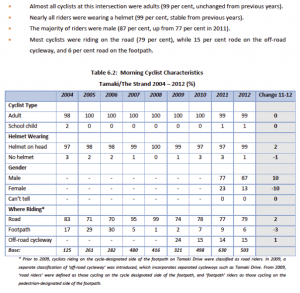
Their data for the morning peak (2012) is at the right:
.
The count is done on Tamaki Drive at the intersection with The Strand, for the morning peak (6:30am to 9:00am) and the evening peak (4:00pm to 7:00pm). This year it was done in fine weather on Tuesday 13 March 2012, and revealed bike usage down 20% from the previous year. The 2011 figure appears to be very high – it was bolstered by six large groups (of more than 10) recreational cyclists.
.
I wondered what the variation was from day-to-day, and what the count was like at mid-winter when the temperature was cold and the days short? So I resolved to get up early (damn early for me) and do a manual bike count observing the
AT protocols!
.
Of course I now have to do this again in mid-summer.
.
My chosen site was on Tamaki Drive, but I counted passing cyclists along by the pedestrian over-bridge to Parnell at Point Resolution (having no personal interest in the movements up or down The Strand).
.
I noted the direction riders were headed, whether they were on the road or shared footpath, and whether they were commuting or recreational riders.
.
I recorded this data for 10 minute periods from 6:30 am to 9 am for seven non-consecutive days towards the end of July 2012 (I was busy the first Sunday, so completed the next weekend).
.
I have observed that no school children use Tamaki Drive to go to school, and substantially everybody wears helmets when riding on the road – so I didn’t survey these characteristics.
.
I also neglected to record the gender of passing cyclists. It’s hard to tell in winter gear and in the dark! I did do a make-of-bike survey a couple of years ago – but that’s another story. . .
.
The results
..
Conclusions (remember this is for the mid-winter morning peak):
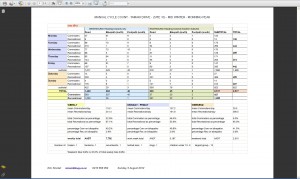 1 – The pattern of bicycle usage is very different from week days, to Saturday and Sunday.
- 2 – Total weekly commuter movements (for the morning peak) are 827.
- 3 – Total weekly recreational usage (for the morning peak) is 1,690.
- 4 – This is an overall weekly split to commuters of 33%, recreational 67%.
 5 – This is a weekly total of 2,517, which gives an Annual Average Daily Traffic (AADT) figure of 7,702.
- 6 – The average number of commuters per weekday (for the morning peak) is 157.
- 7 – The average number recreational riders per weekend (for the morning peak) is 390.
 8 – At the weekends 95% of all bike traffic is recreational. I observed that rather than dropping off after the morning peak (like commuting) the recreational cycling traffic continues, probably reaching it’s maximum around the early afternoon.
- 9 – During the weekdays 46% of cyclists were commuting, and 54% recreational.
- 10 – 50% of all weekday commuters used the shared path on the Waitemata Harbour side!
- 11 – Almost no one uses the shared path on the Hobson Bay (south) side of Tamaki Drive.
 12 – Weekend bike traffic is 33% of the total weekly bike traffic. I consider this very low – for example weekend bike traffic over the Golden Gate Bridge is 82% of the weekly total. I think the bike traffic is self-moderating, as due to the high volume and speed of motorised traffic many cyclists are now avoiding Tamaki Drive during weekends. Critical Mass it ain’t!
- 13 – Over the week (for the morning peak) I saw only one person not wearing a helmet (they were on the footpath), no school kids going to school, one tandem, one recumbent, one dog (as a passenger).
- 14 – The largest bunch I saw was 13 riders, and indeed over the whole week there were only 39 groups of 5 or more cyclists. That’s an average of 5 groups per morning peak (2 ½ hours) including the weekends.
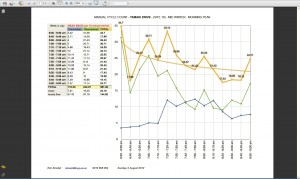 15 – It’s clear that the recreational riders are up and about earlier, and peter out after 7:30am.
- 16 – Commuting intensity is more evenly spread but reaches it’s maximum level by 7:30am.
- 17 – Tuesday is the busiest day for commuting, Monday the least busiest workday. But around a mean of 157 there is not much variation – the lowest is 123, and 175 the highest.
- 18 – Saturday is the busiest day for recreational cycling on the waterfront, but surprisingly Tuesday and Friday are almost as popular as Sunday. The Saturday figures are bolstered by the Time Trial held early in the morning.
- 19 – The lowest morning peak figure was for Wednesday – on which day it was drizzling. The commuting figure was less affected. But recreational cyclists are obviously fair-weather riders.
- 20 – Link here to all the day-by-day data in detail should anybody be interested. . .
 I wondered what the variation was from day-to-day, and what the count was like at mid-winter when the temperature was cold and the days short? So I resolved to get up early (damn early for me) and do a manual bike count observing the AT protocols!
 1 – The pattern of bicycle usage is very different from week days, to Saturday and Sunday.
 5 – This is a weekly total of 2,517, which gives an Annual Average Daily Traffic (AADT) figure of 7,702.
 8 – At the weekends 95% of all bike traffic is recreational. I observed that rather than dropping off after the morning peak (like commuting) the recreational cycling traffic continues, probably reaching it’s maximum around the early afternoon.
 12 – Weekend bike traffic is 33% of the total weekly bike traffic. I consider this very low – for example weekend bike traffic over the Golden Gate Bridge is 82% of the weekly total. I think the bike traffic is self-moderating, as due to the high volume and speed of motorised traffic many cyclists are now avoiding Tamaki Drive during weekends. Critical Mass it ain’t!
 15 – It’s clear that the recreational riders are up and about earlier, and peter out after 7:30am.


