Judging just by the number of riders we’re seeing on these chilly but sunny spring mornings, Aucklanders are flocking to biking more and more. But do the bike counts of the past winter back up that impression?
At 14 regional count sites:
- 1.66 million cycle trips were recorded for the year of September 2015 to August 2016, an increase of 8.8% on the previous 12 months.
- 123,388 cycle trips were recorded in August 2016, an increase of 13.9% when compared to August 2015.
At 13 city centre count sites (which don’t all yet have 12 months of data to compare to the previous year):
- 1.74 million cycle trips were recorded/estimated for the year of September 2015 to August 2016
- 130,523 cycle trips were recorded in August 2016
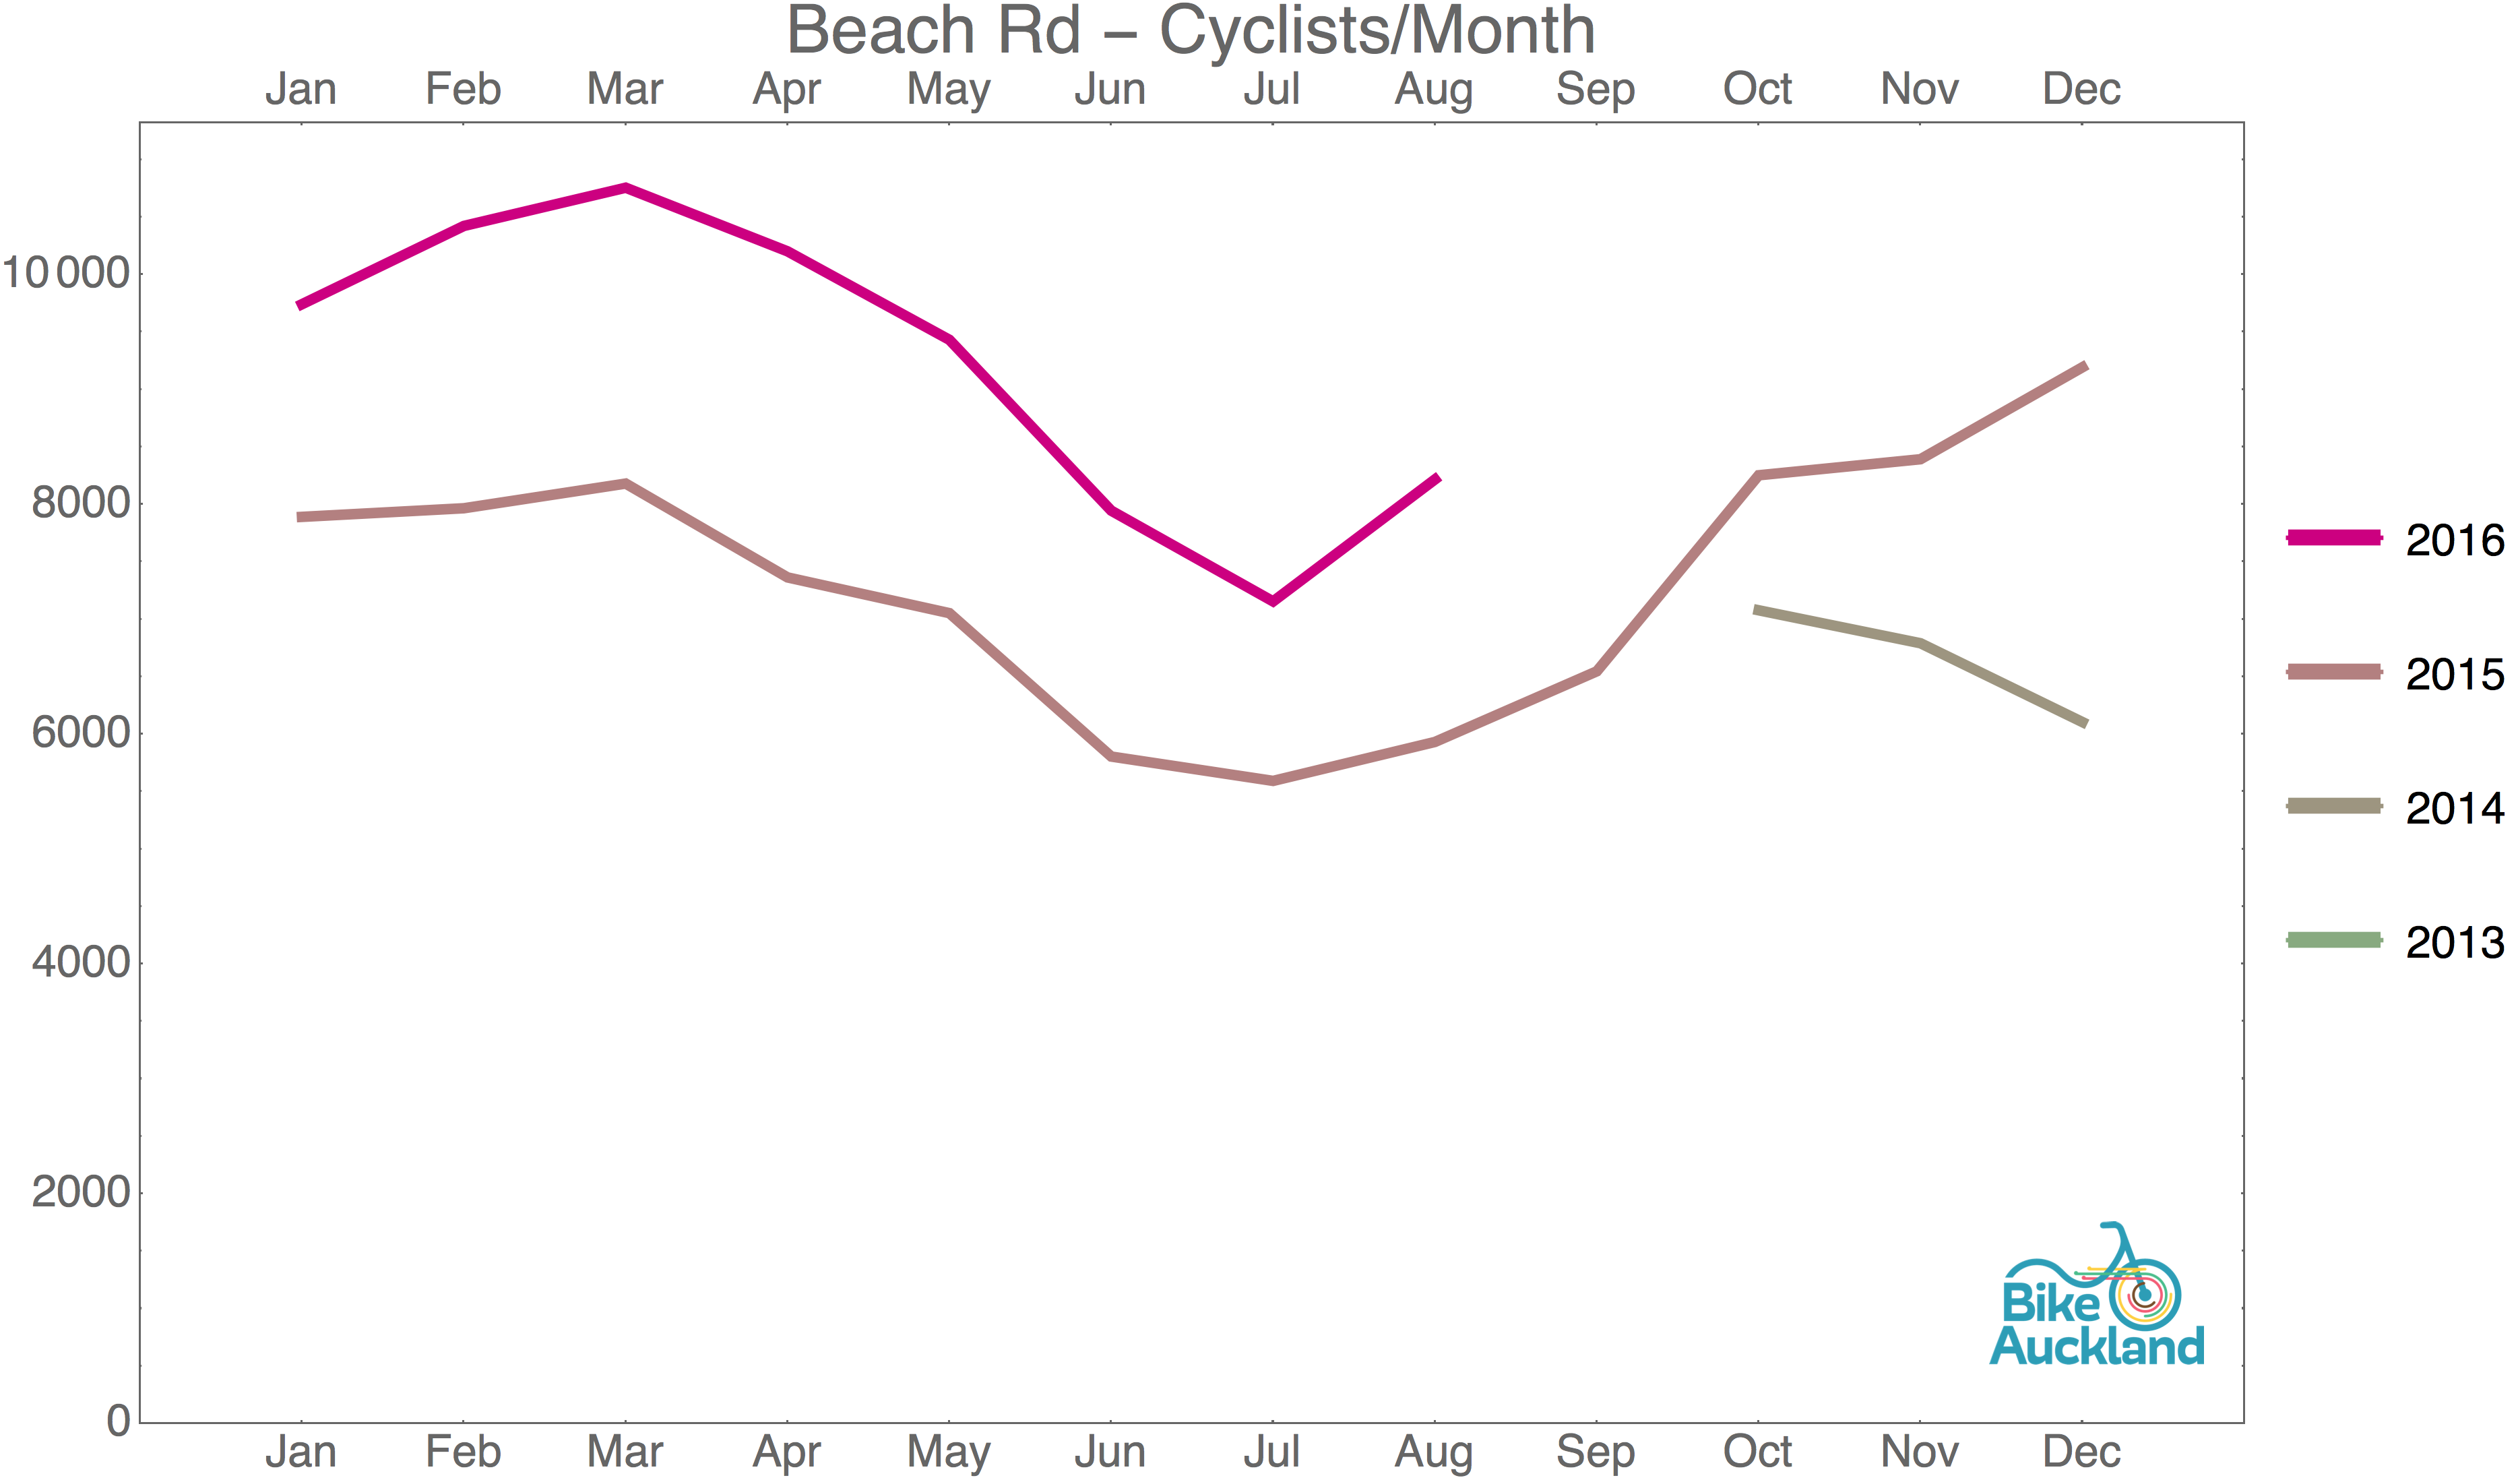
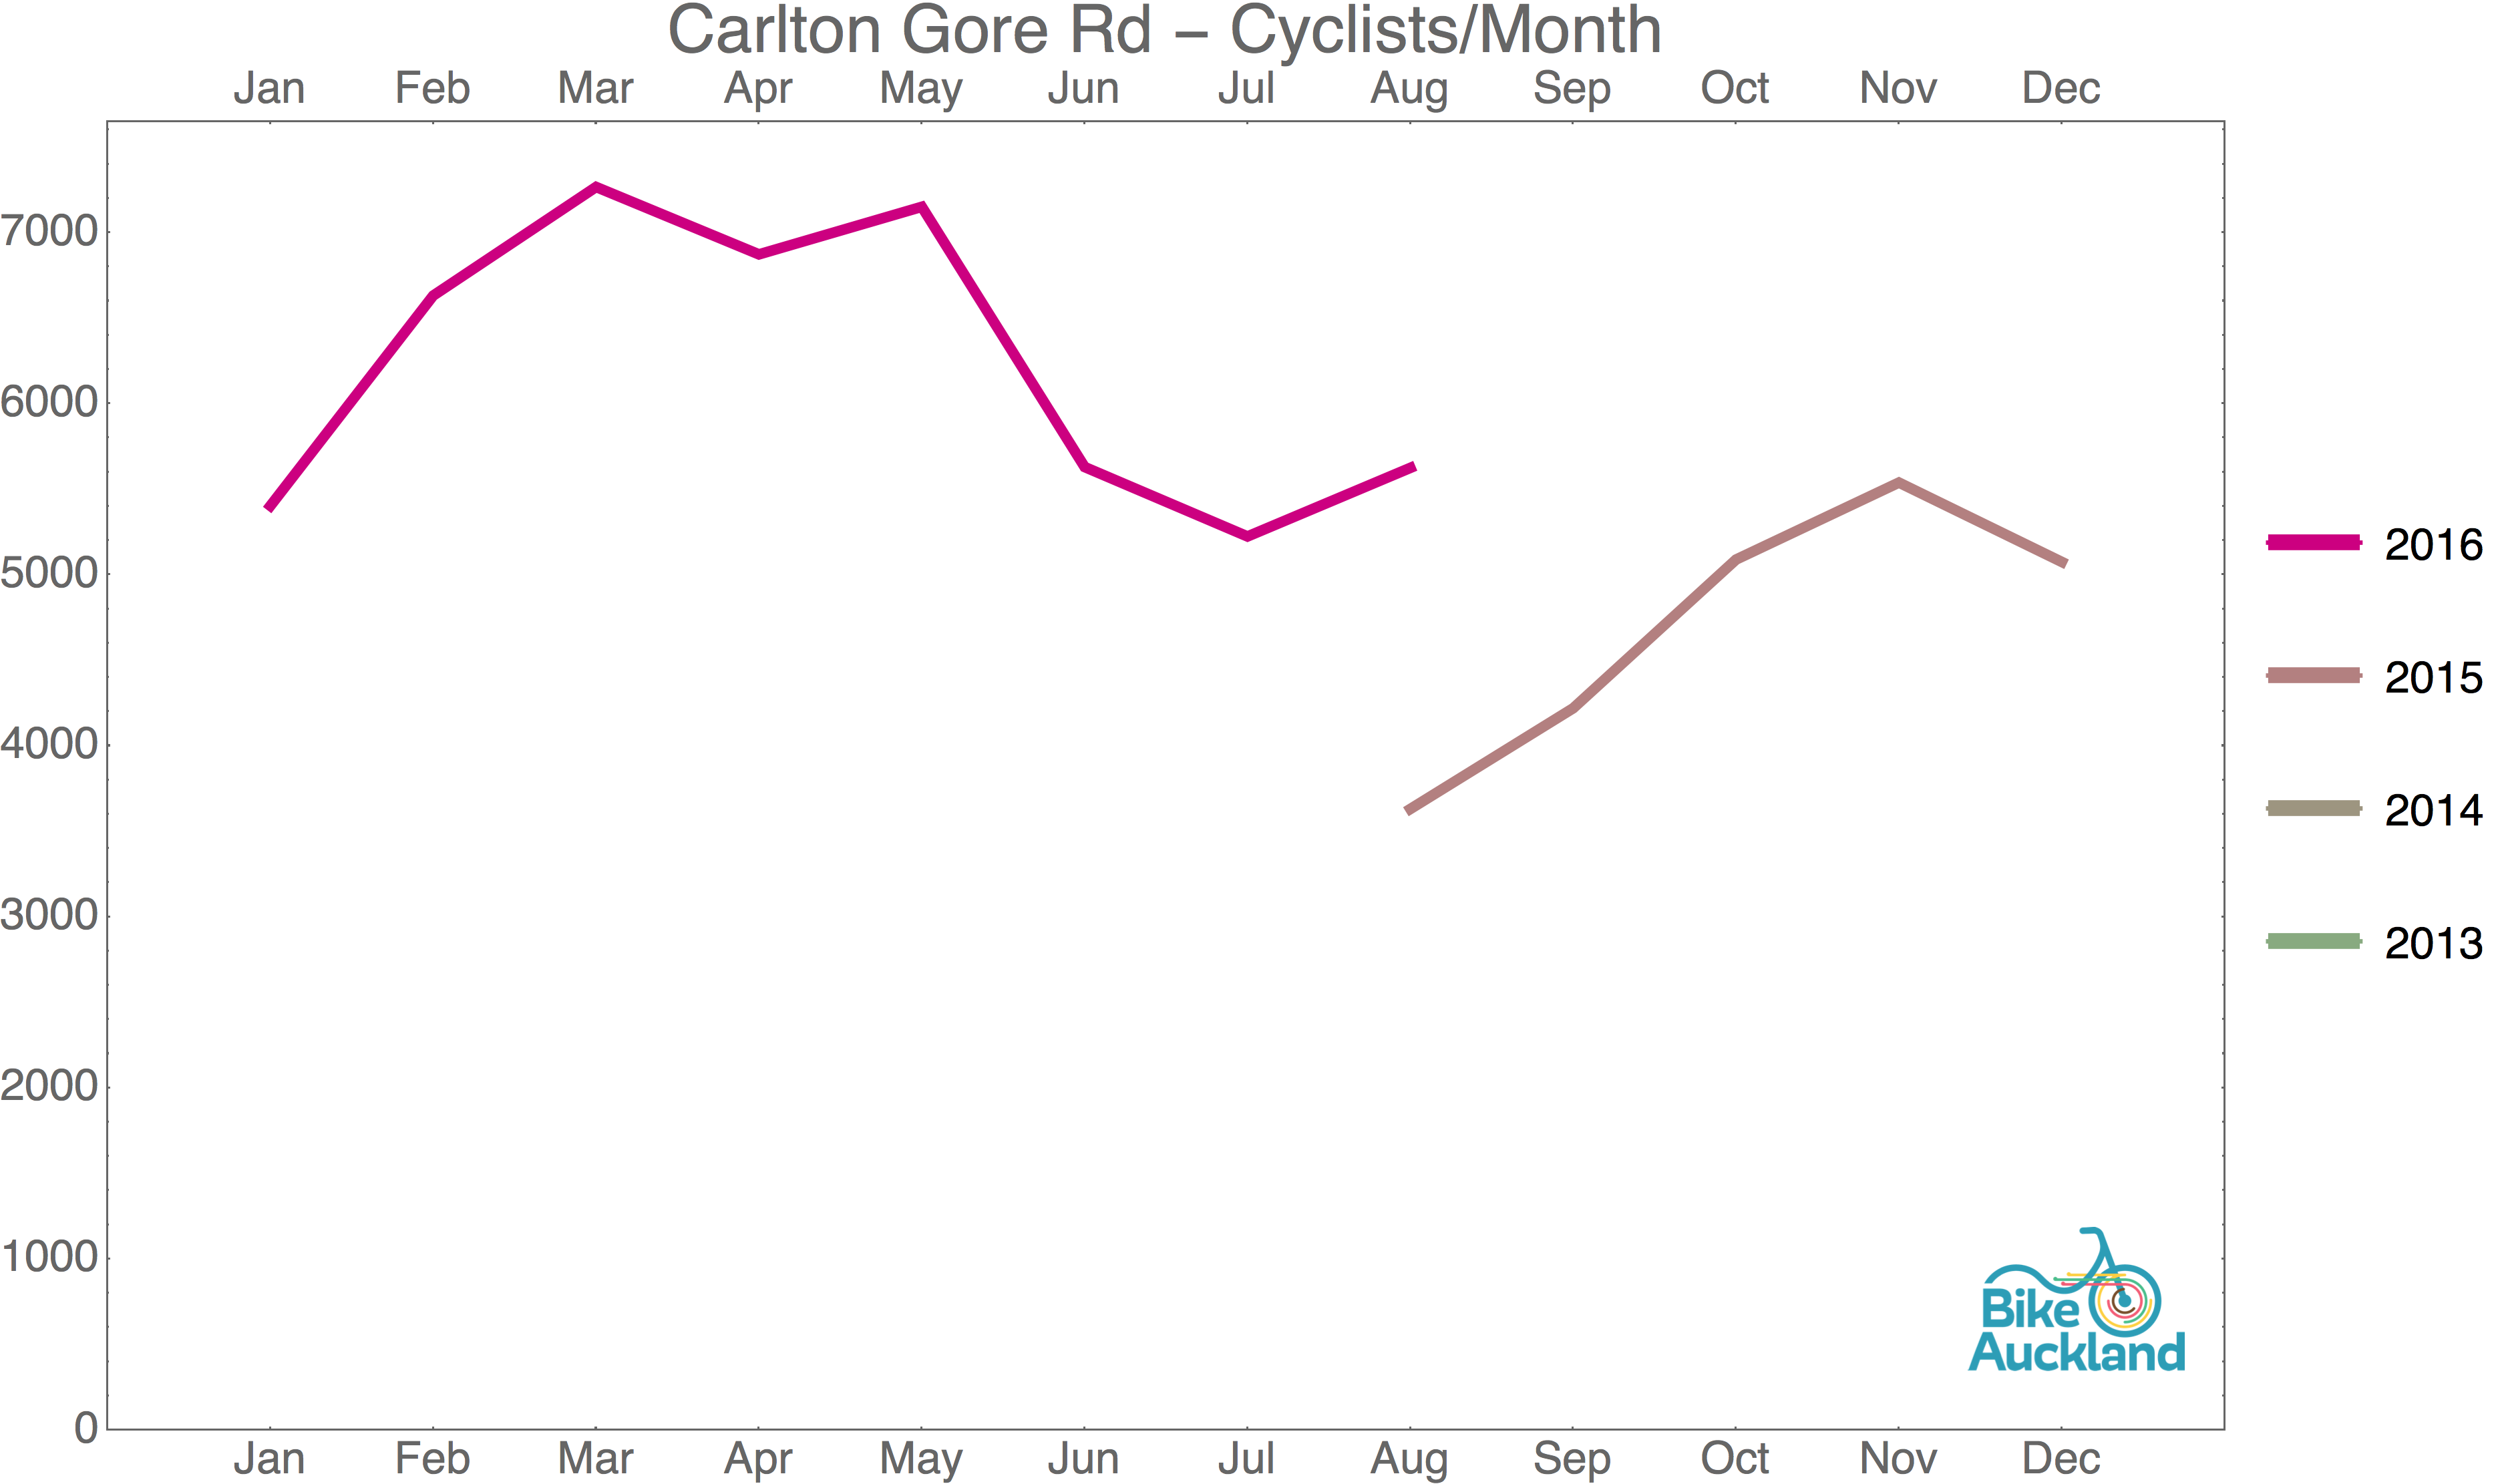
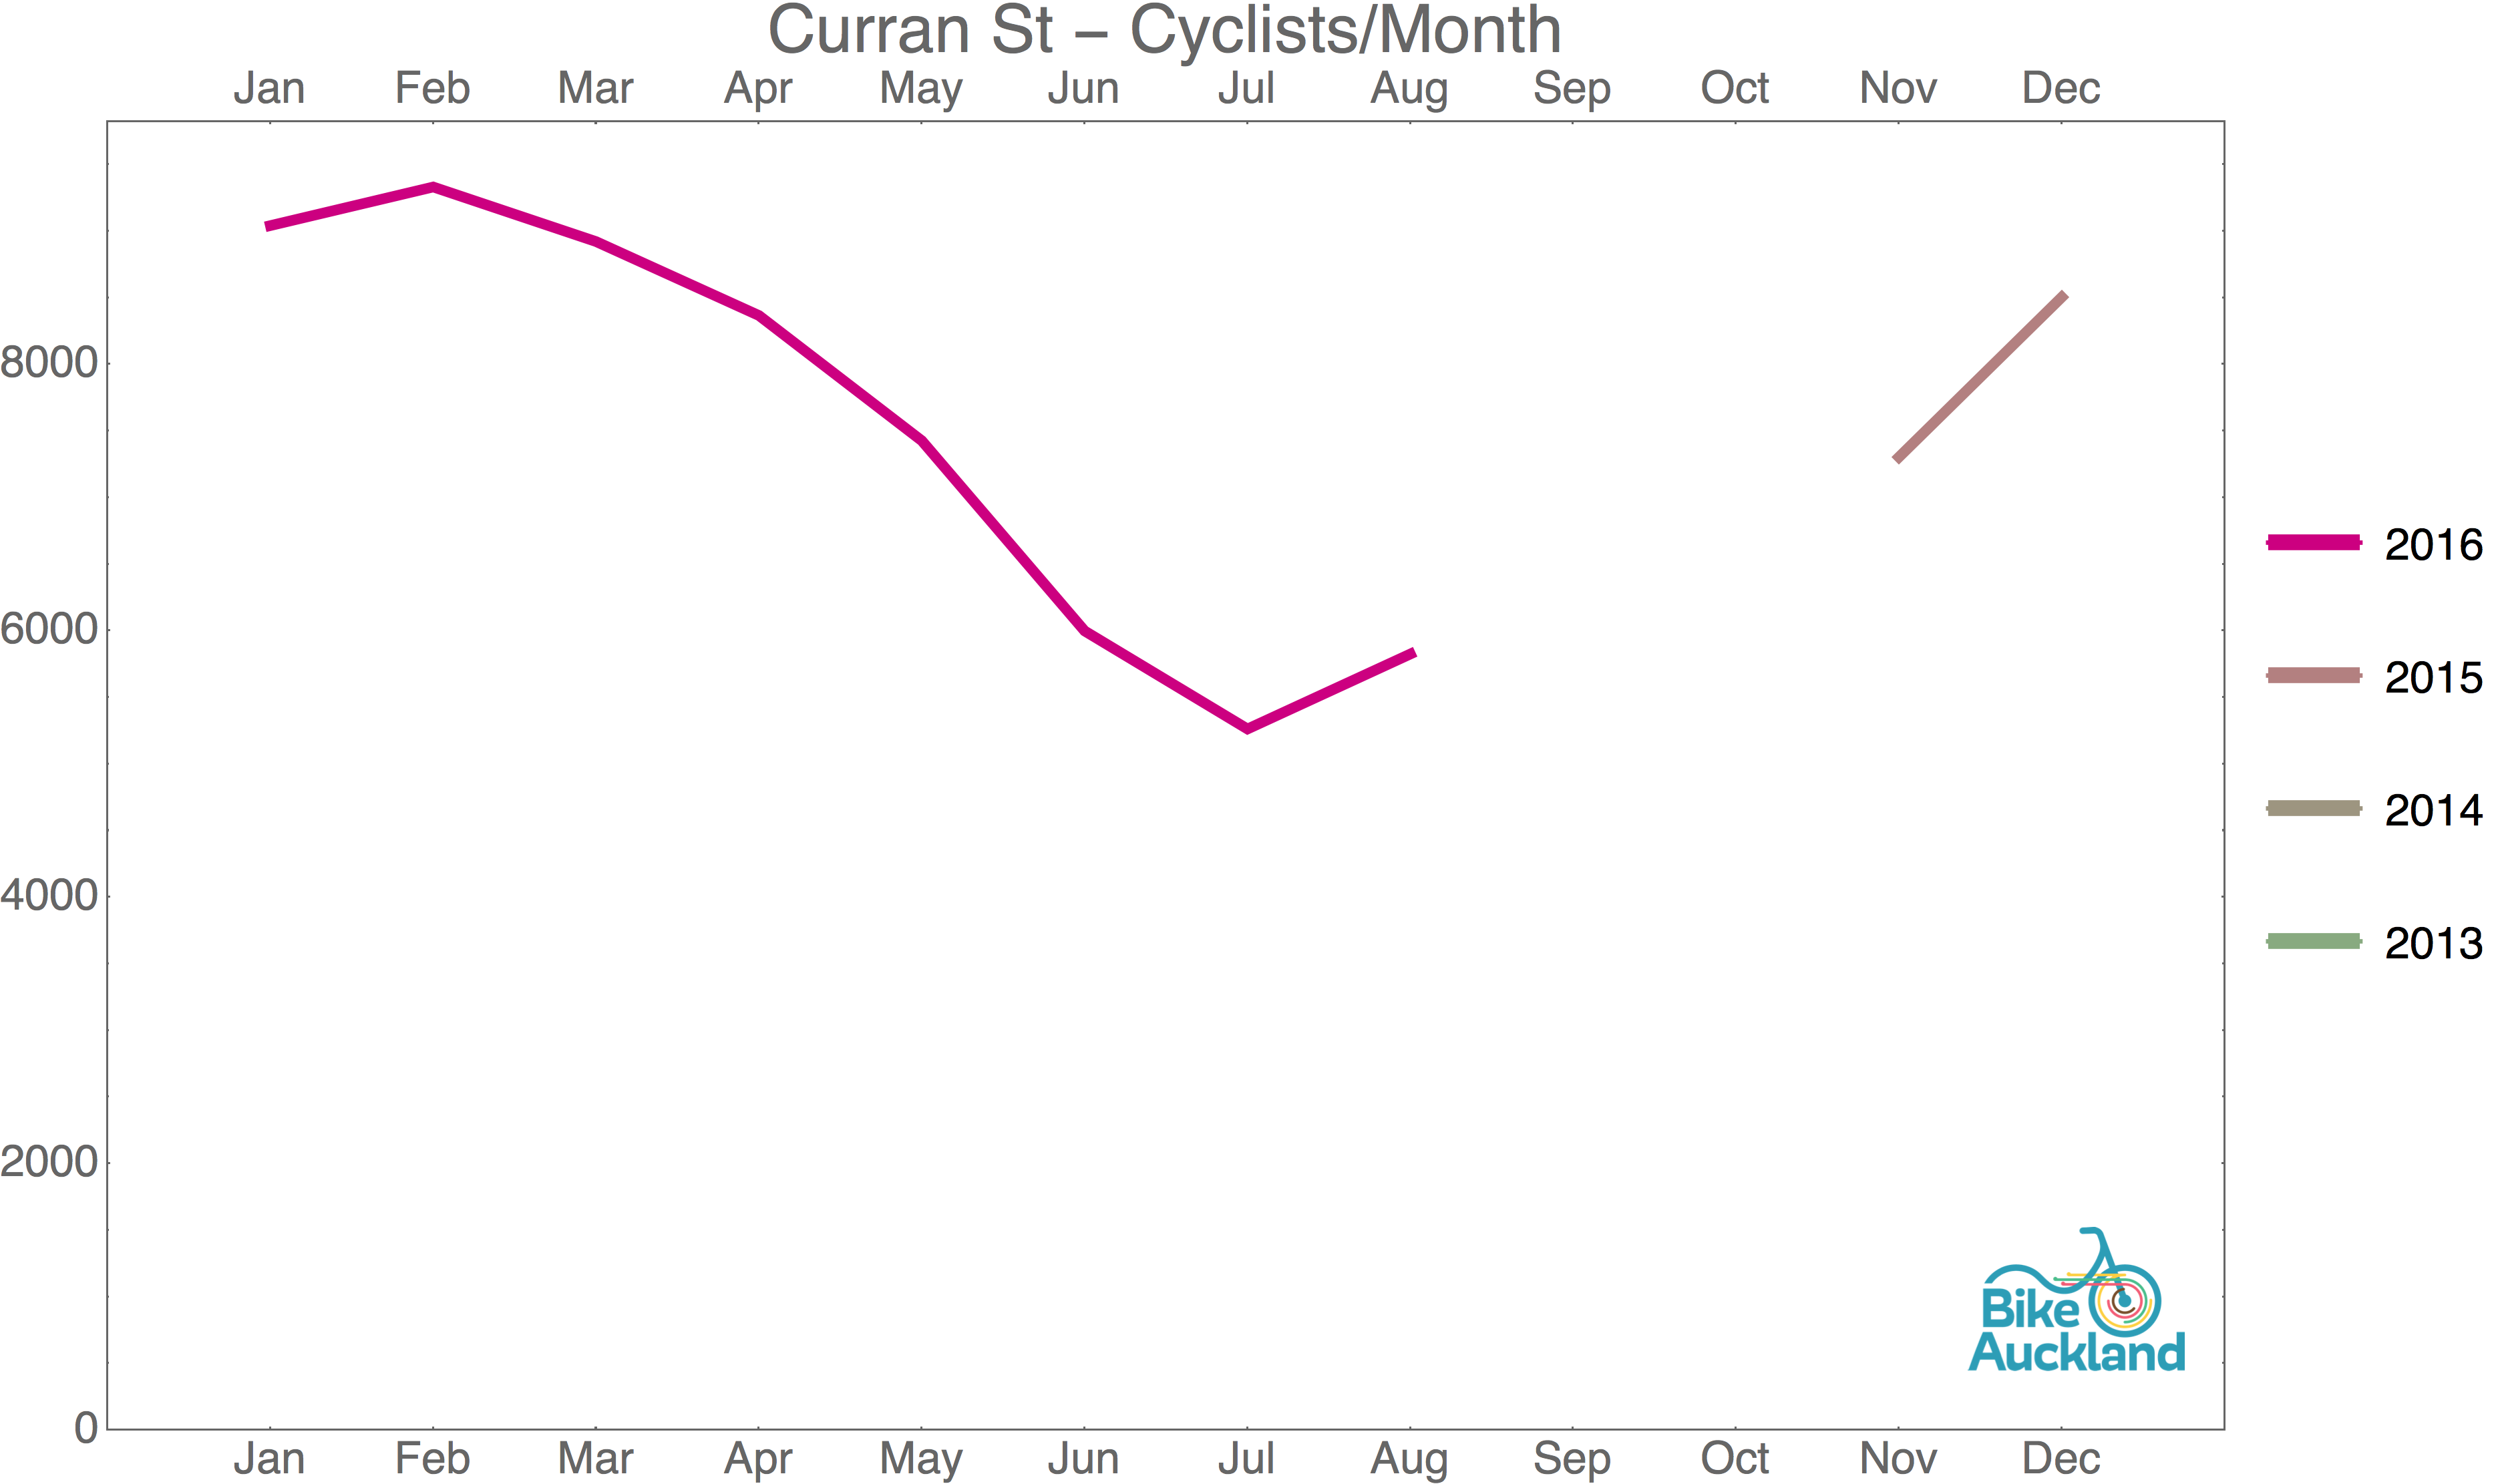
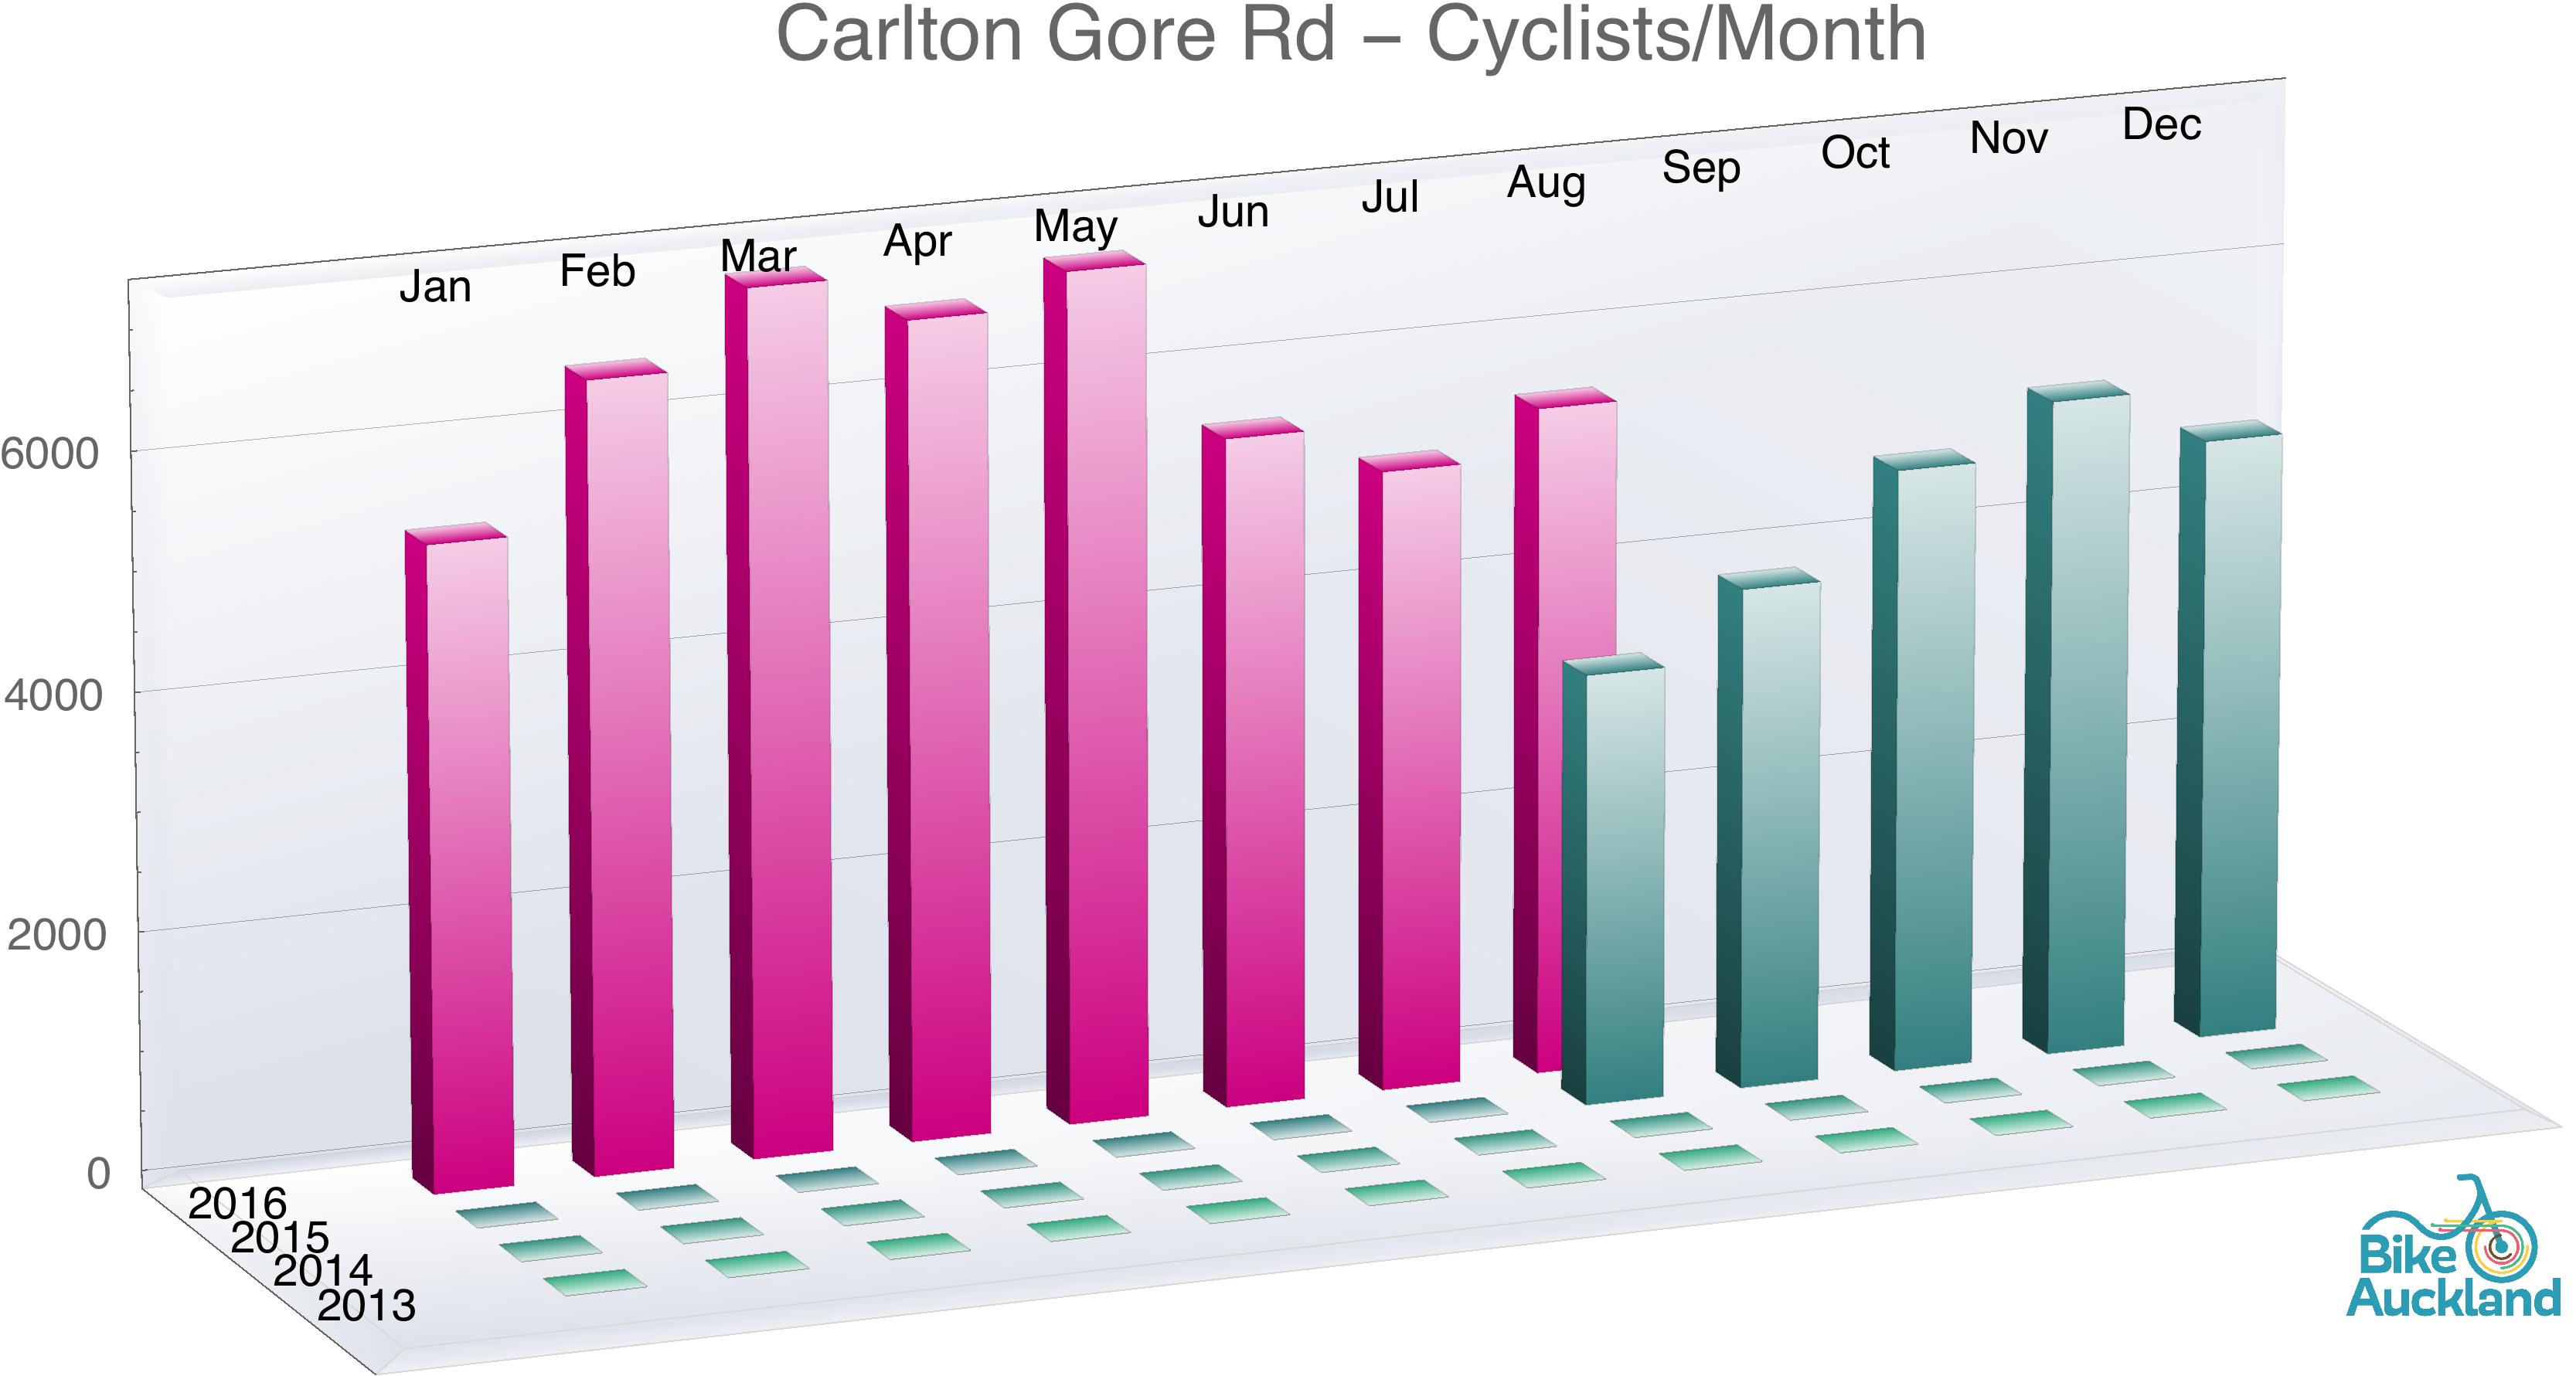
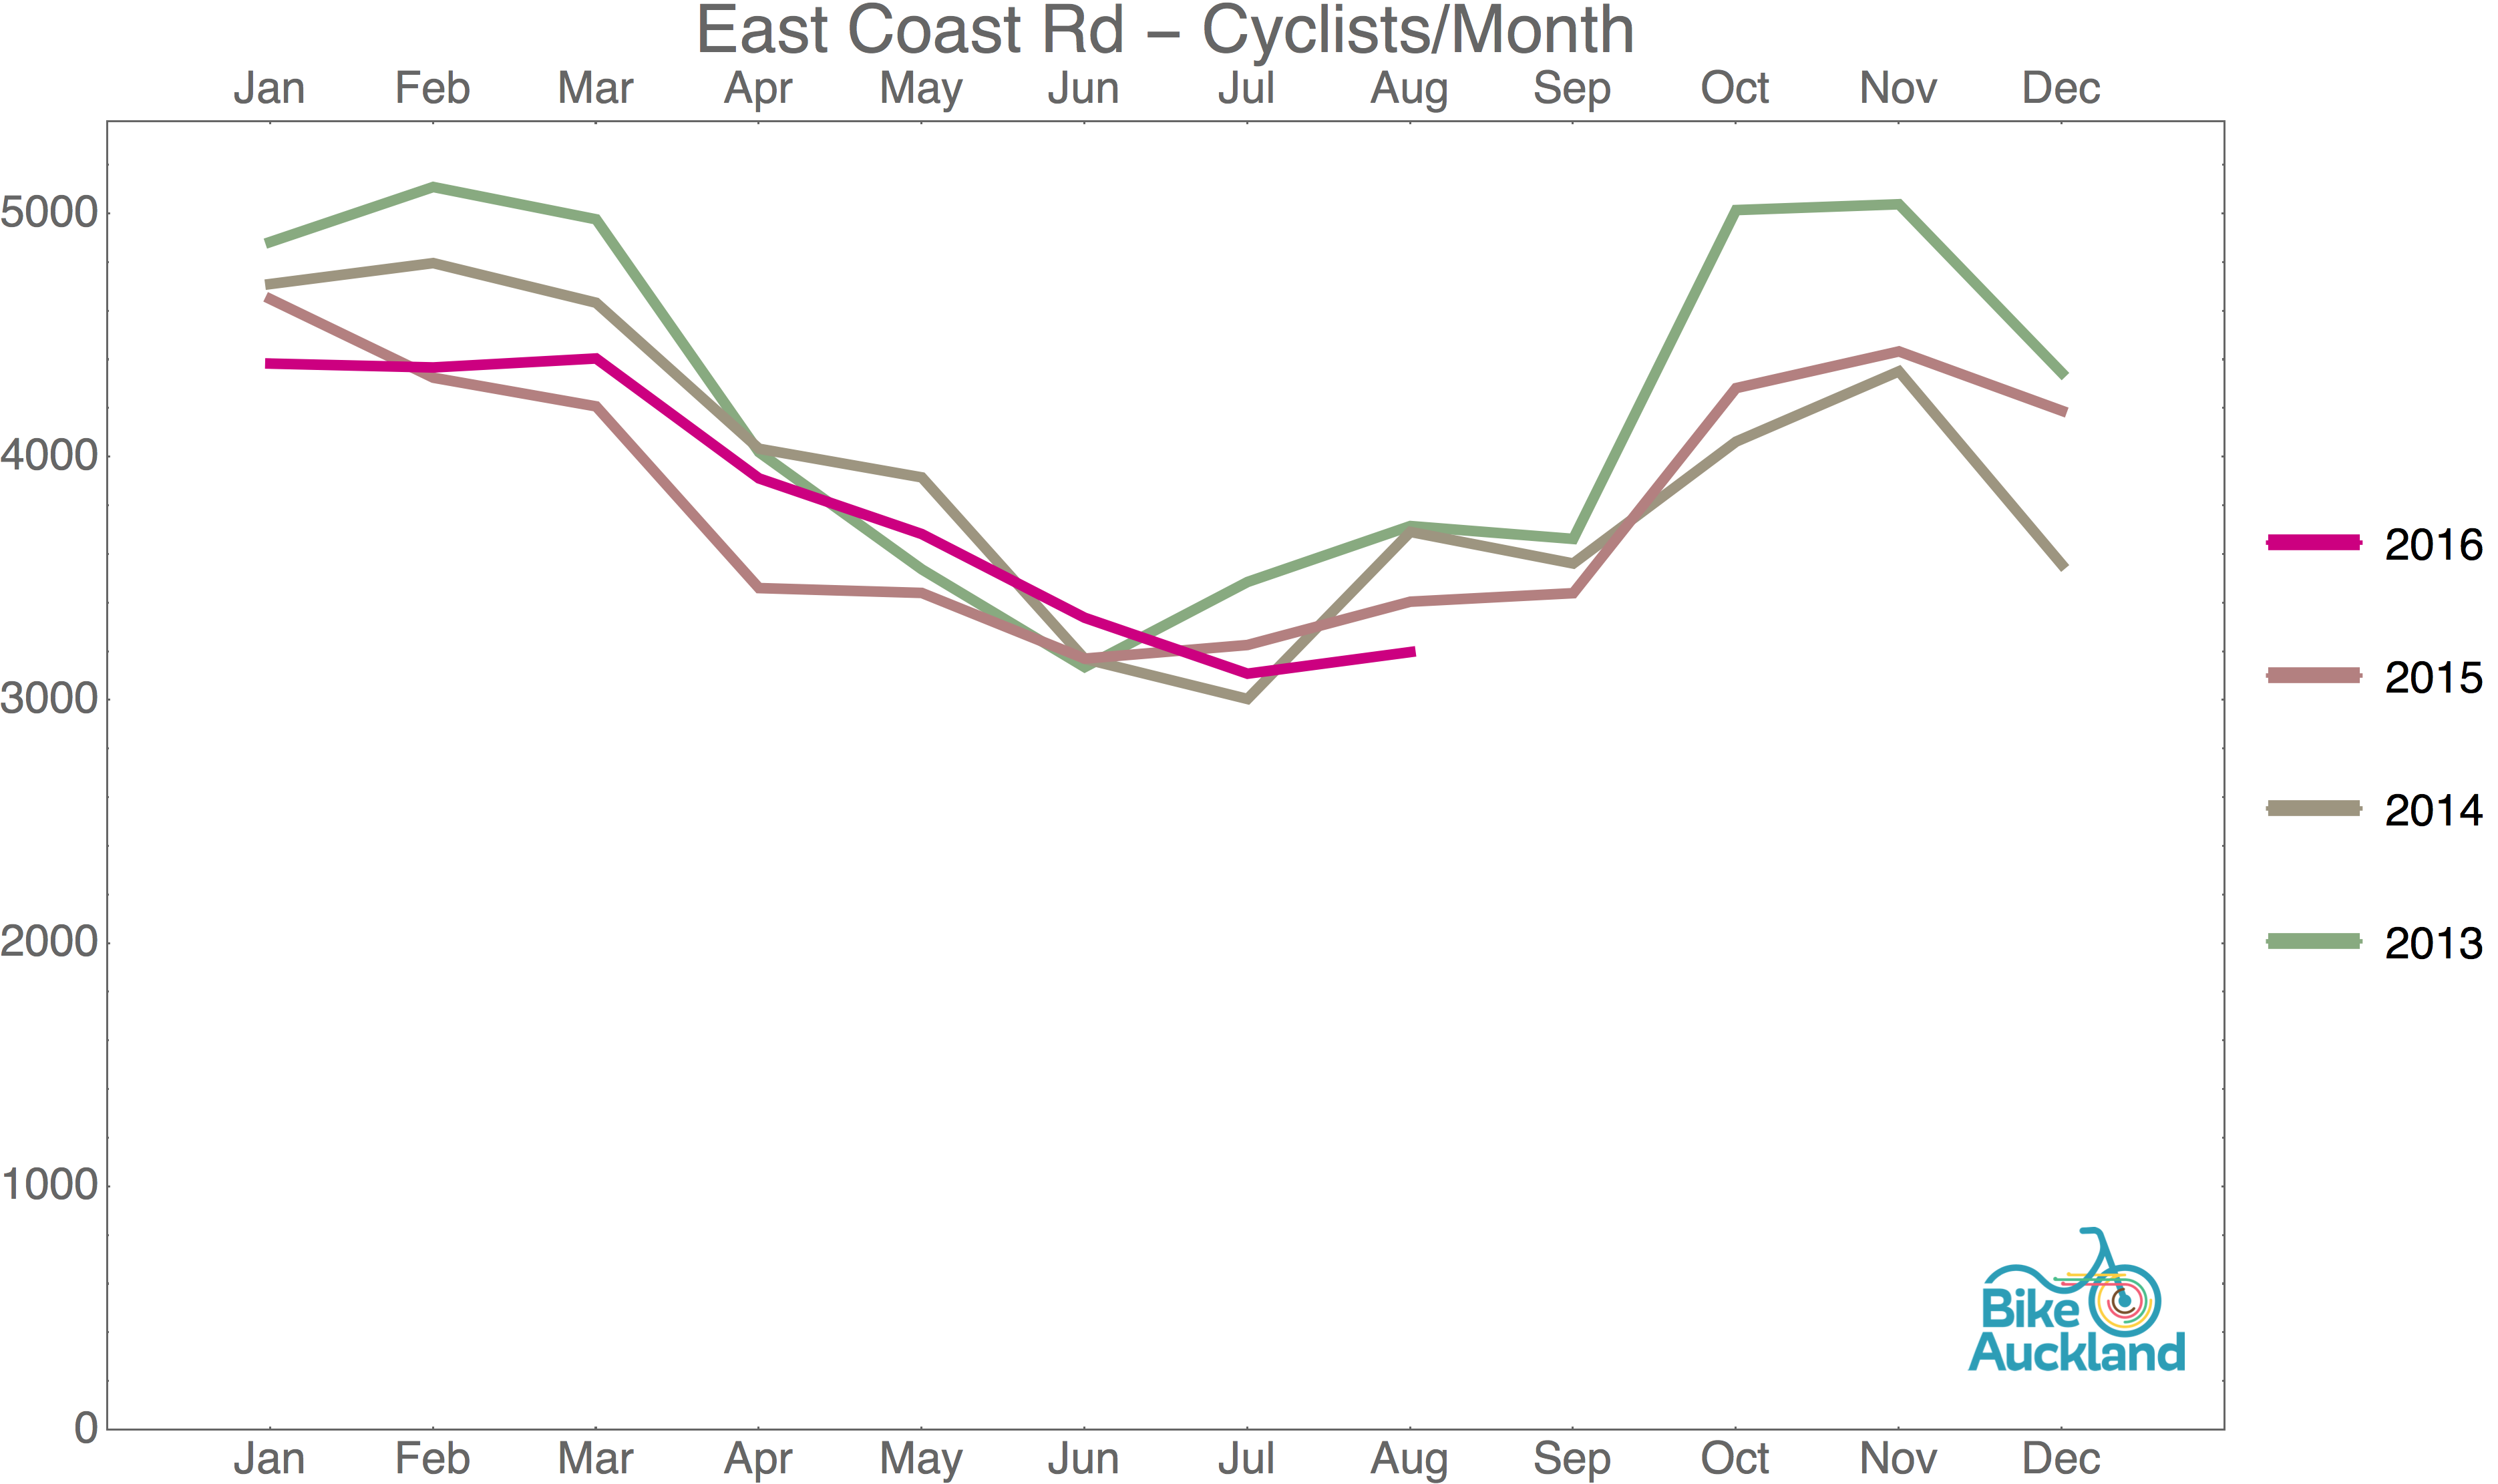
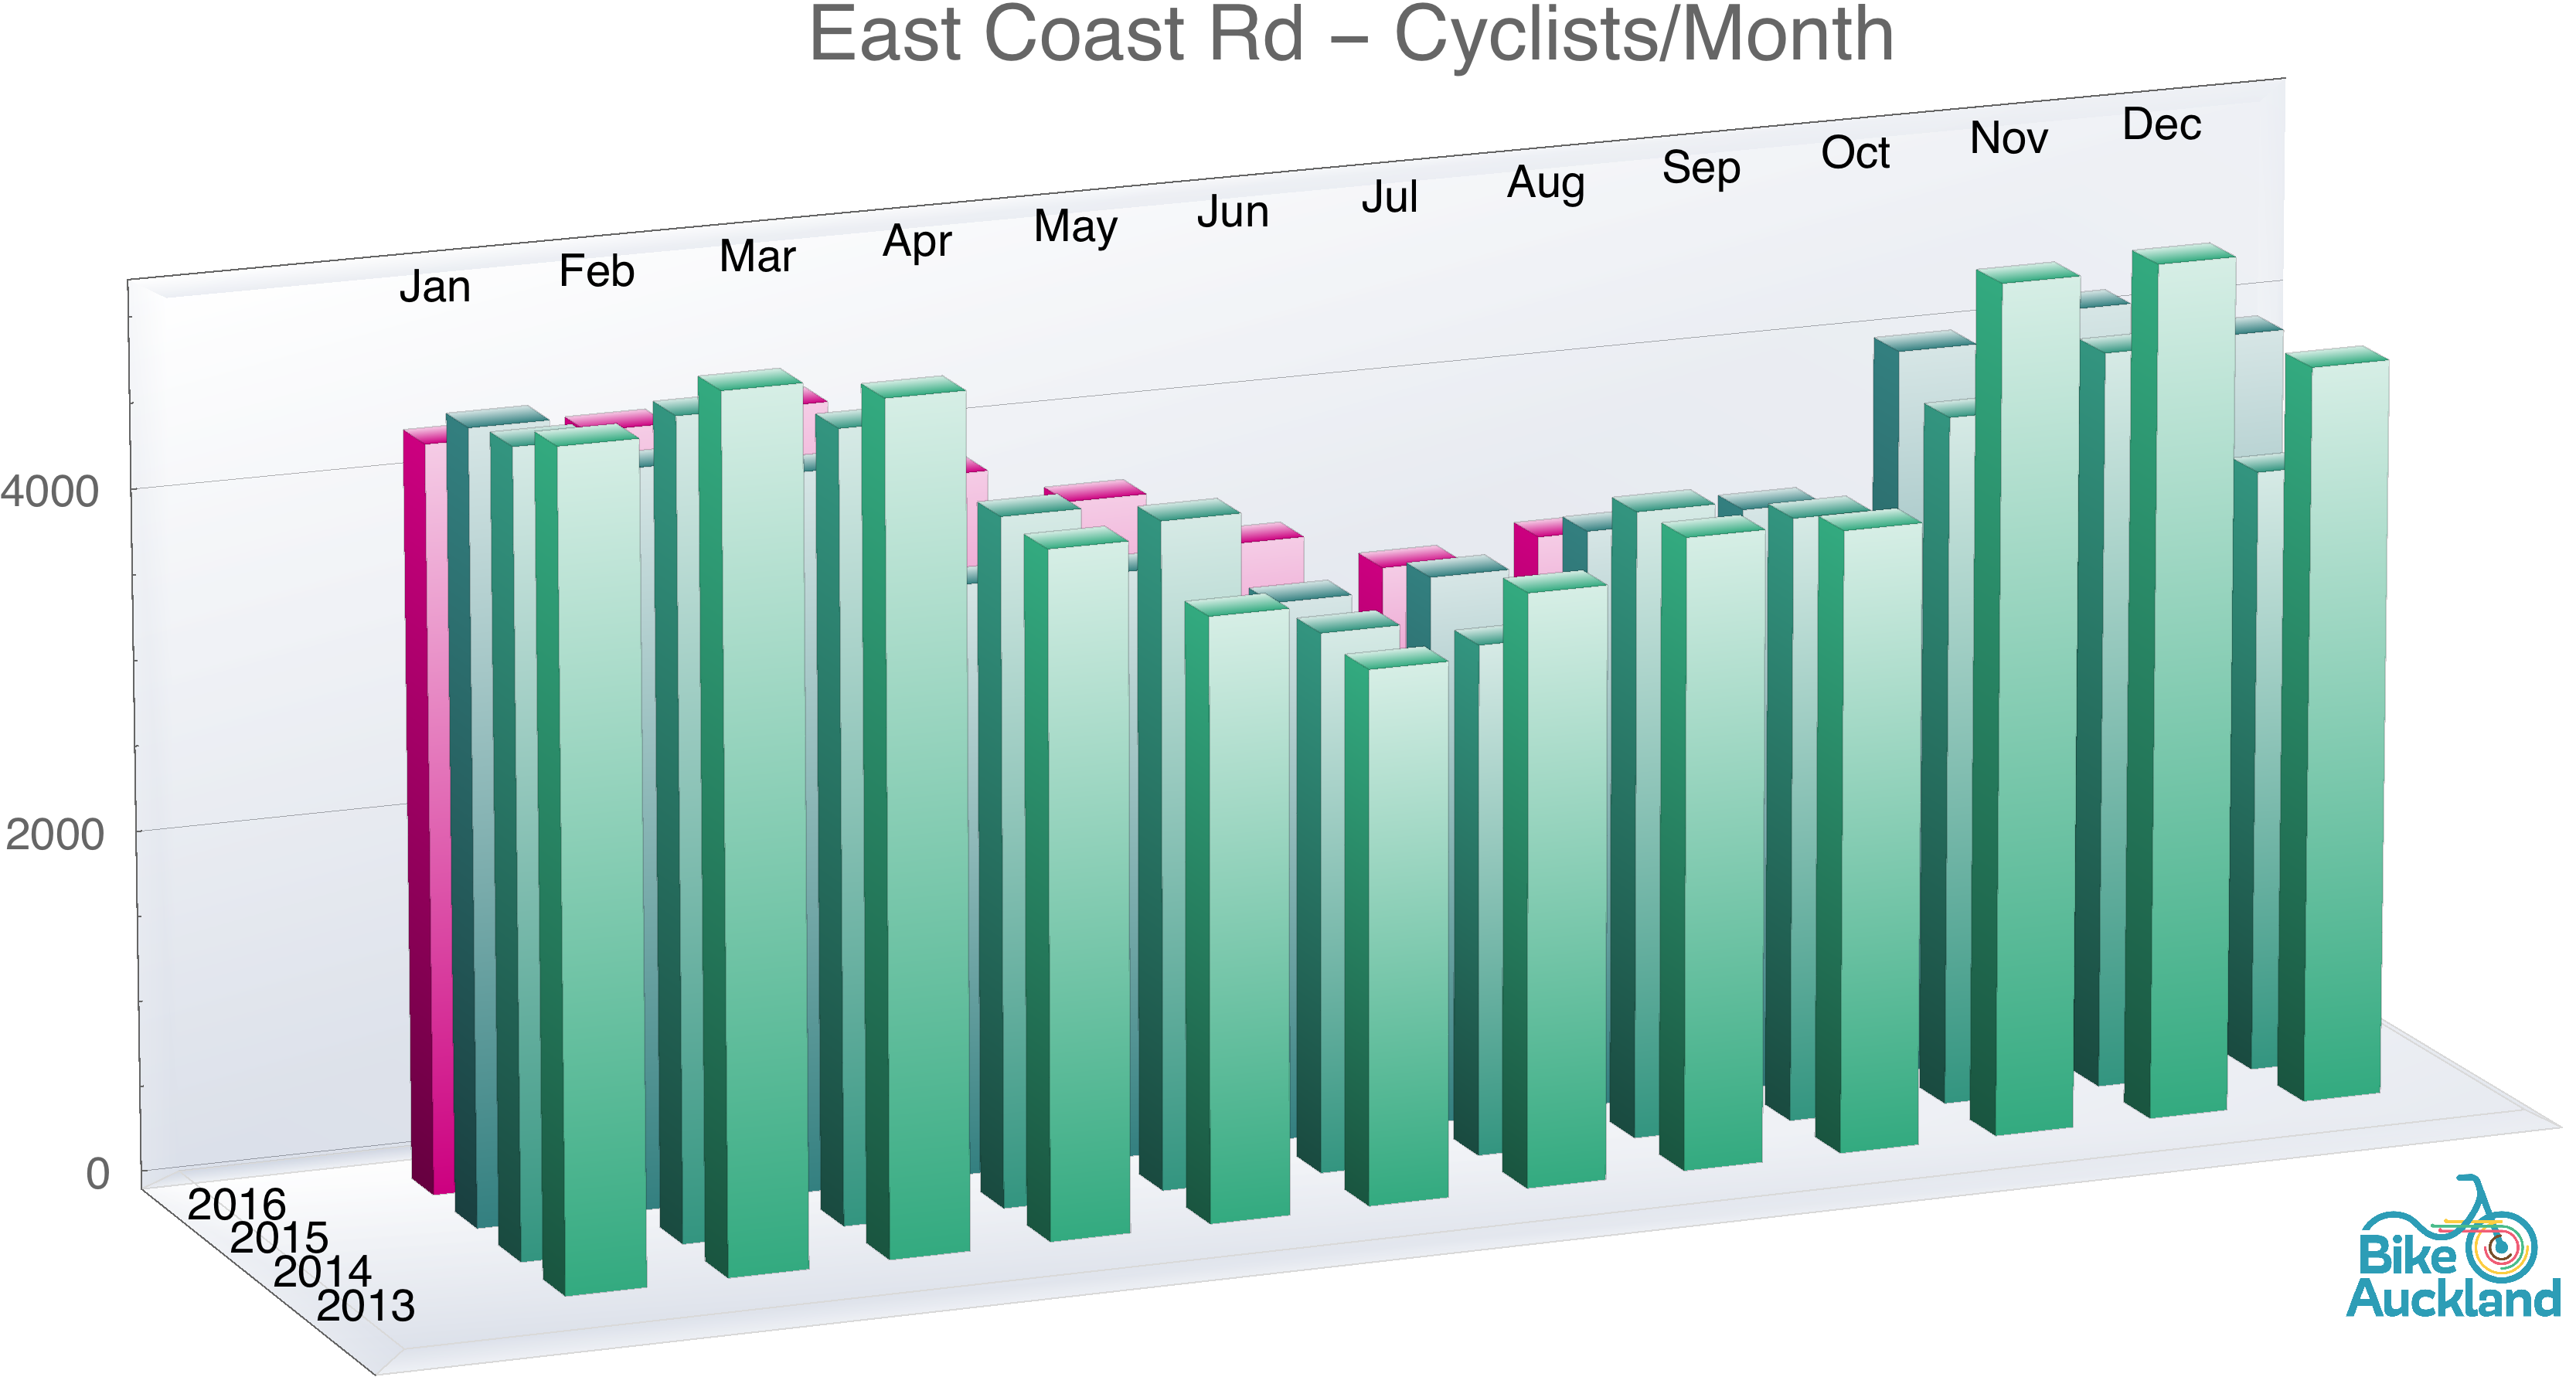
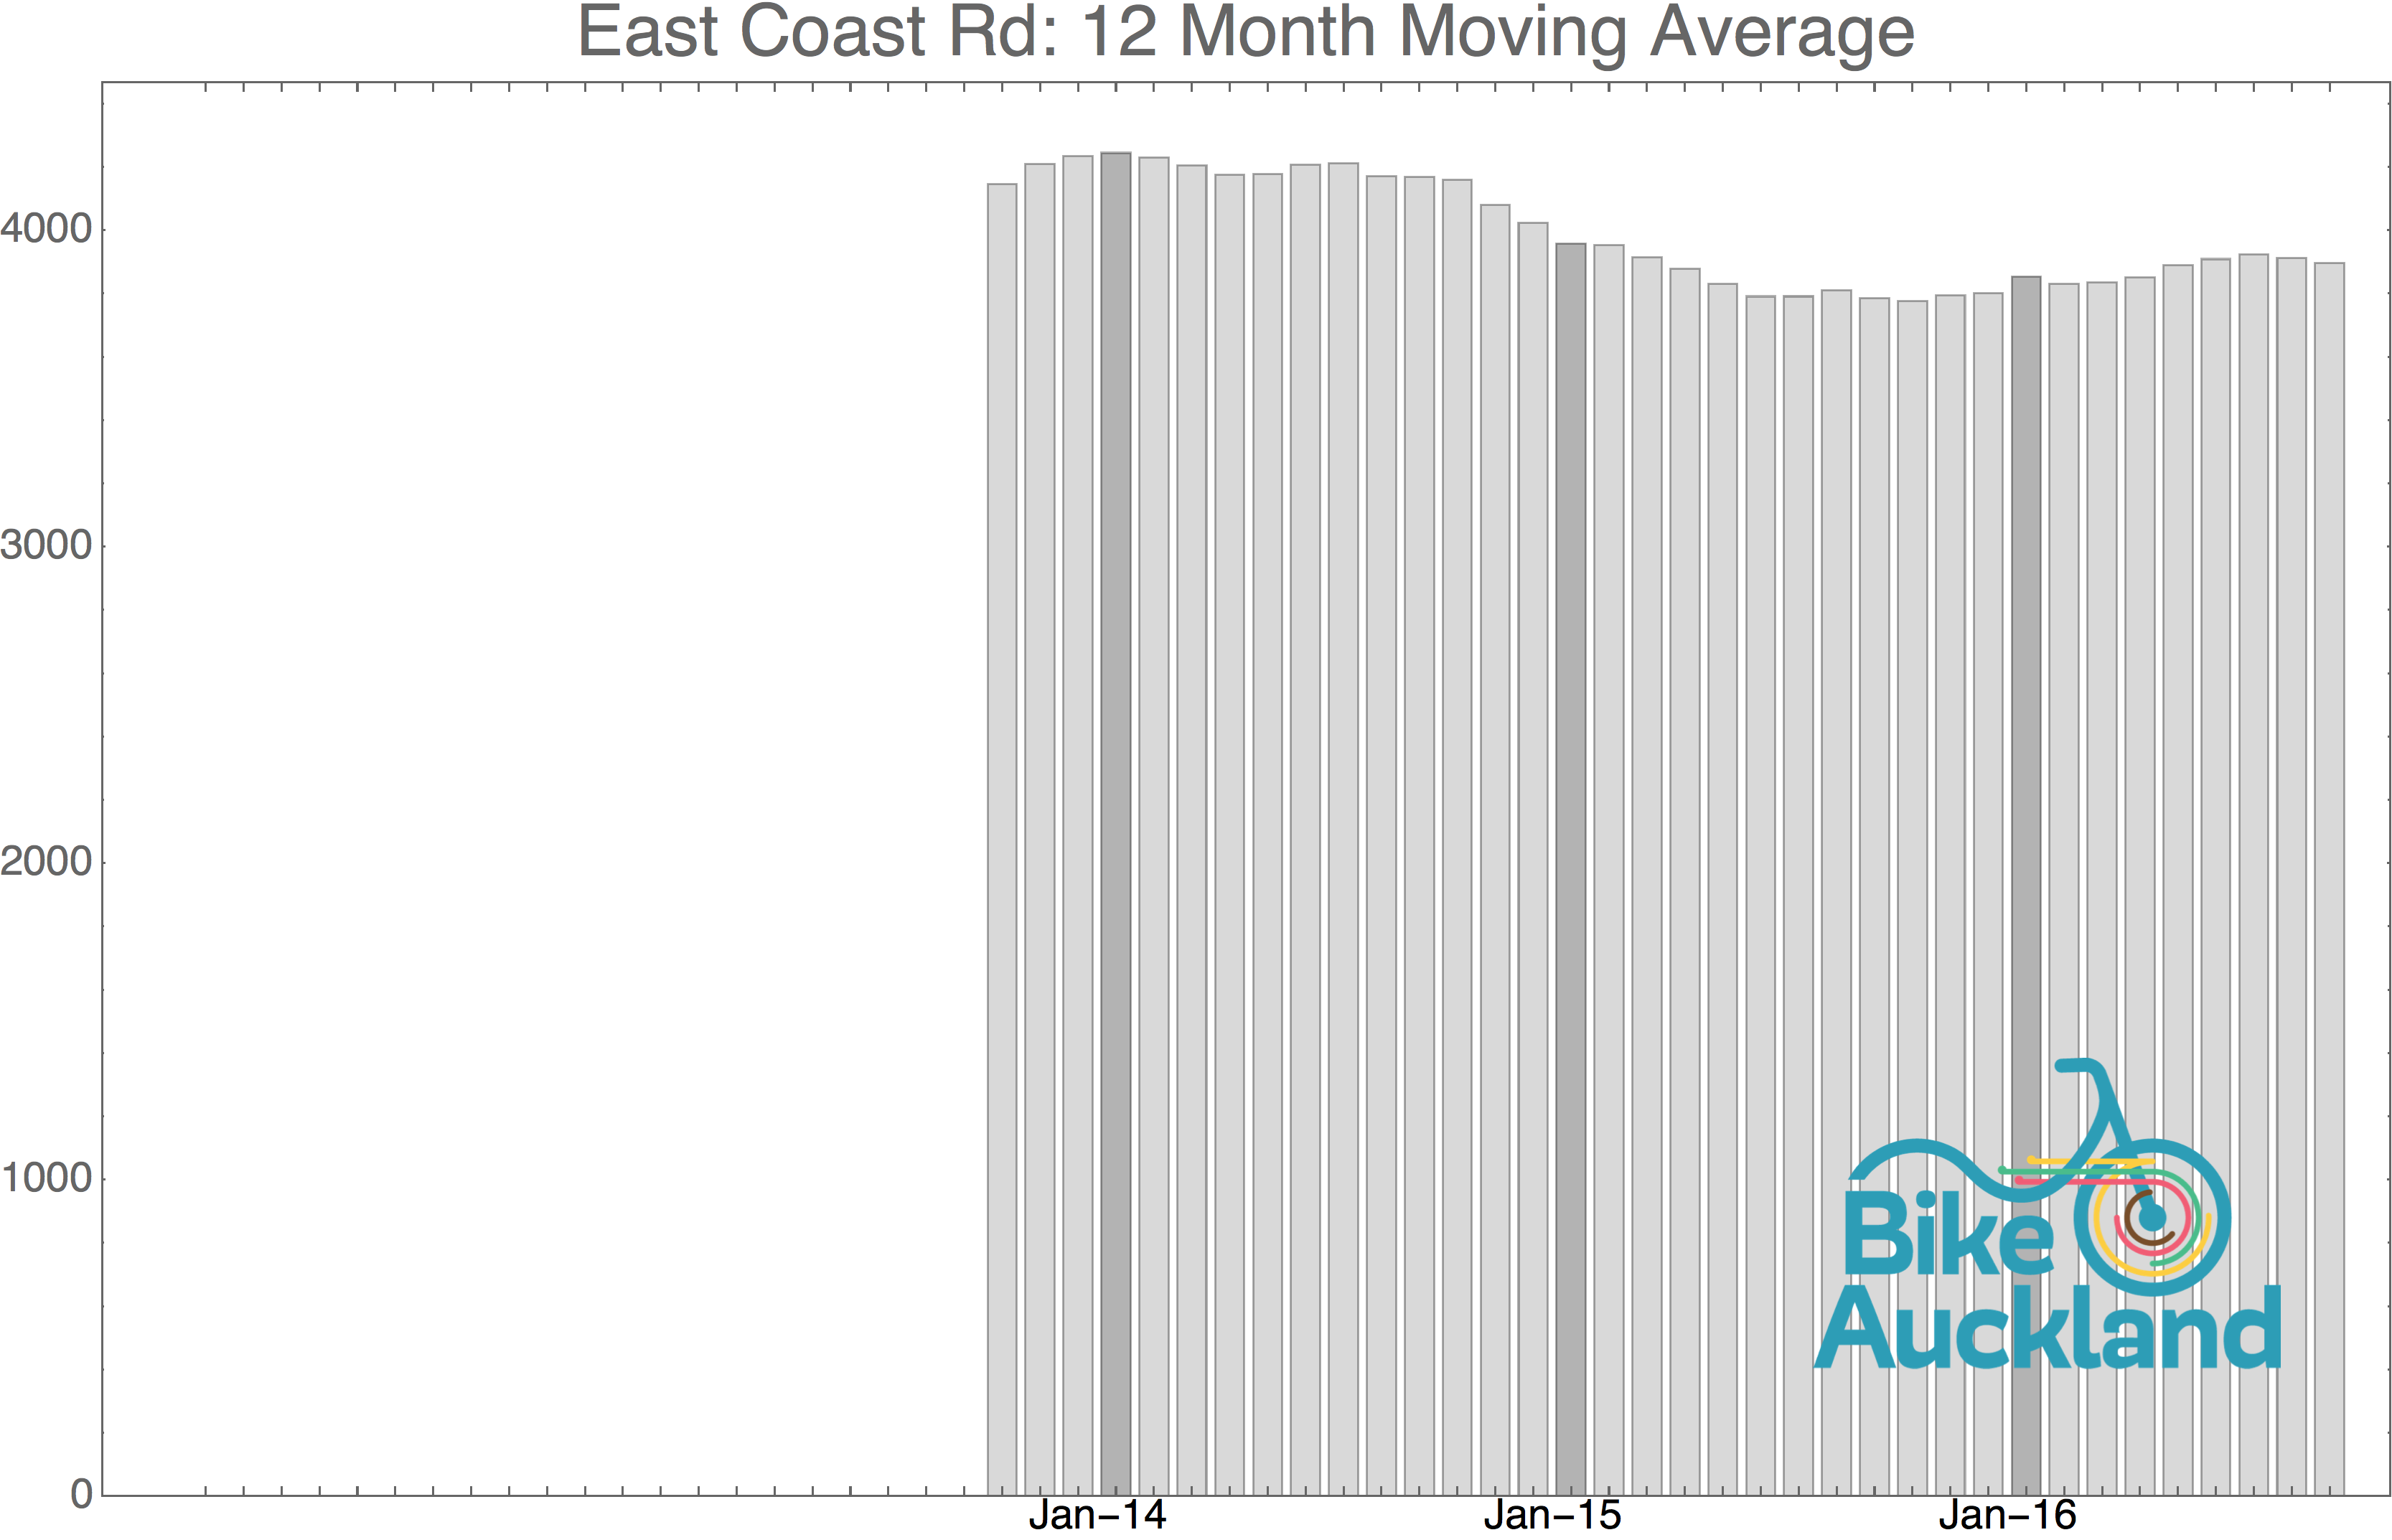
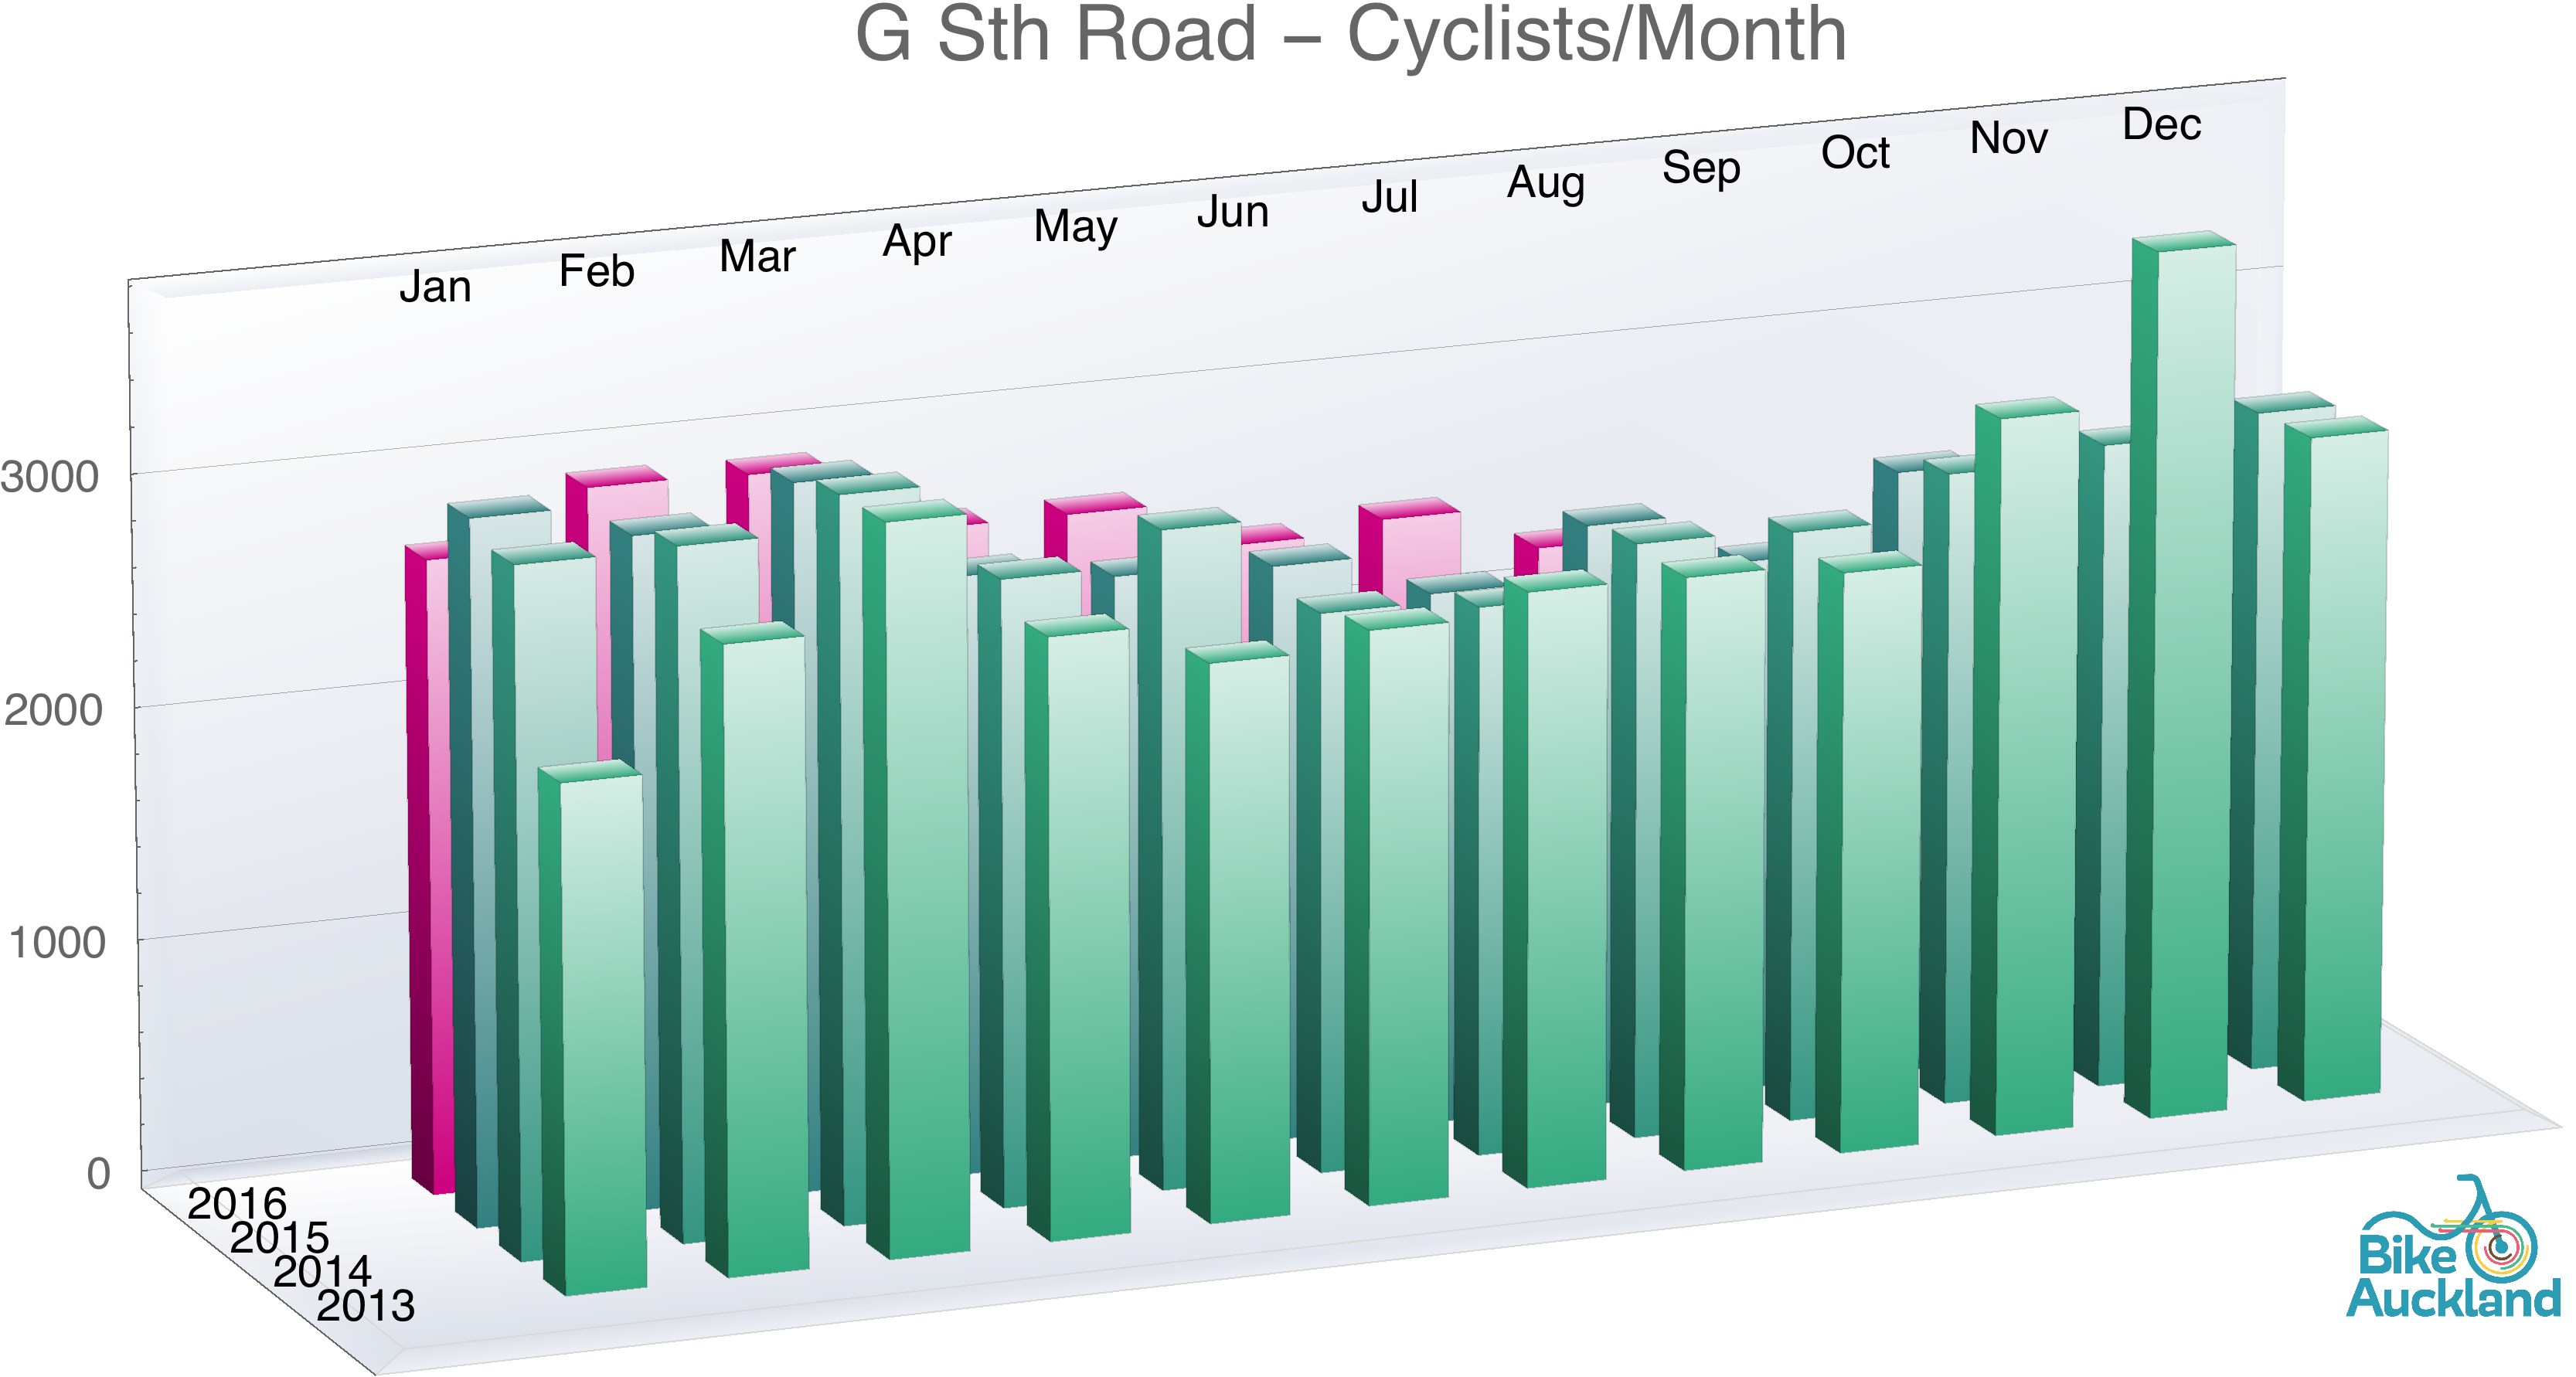
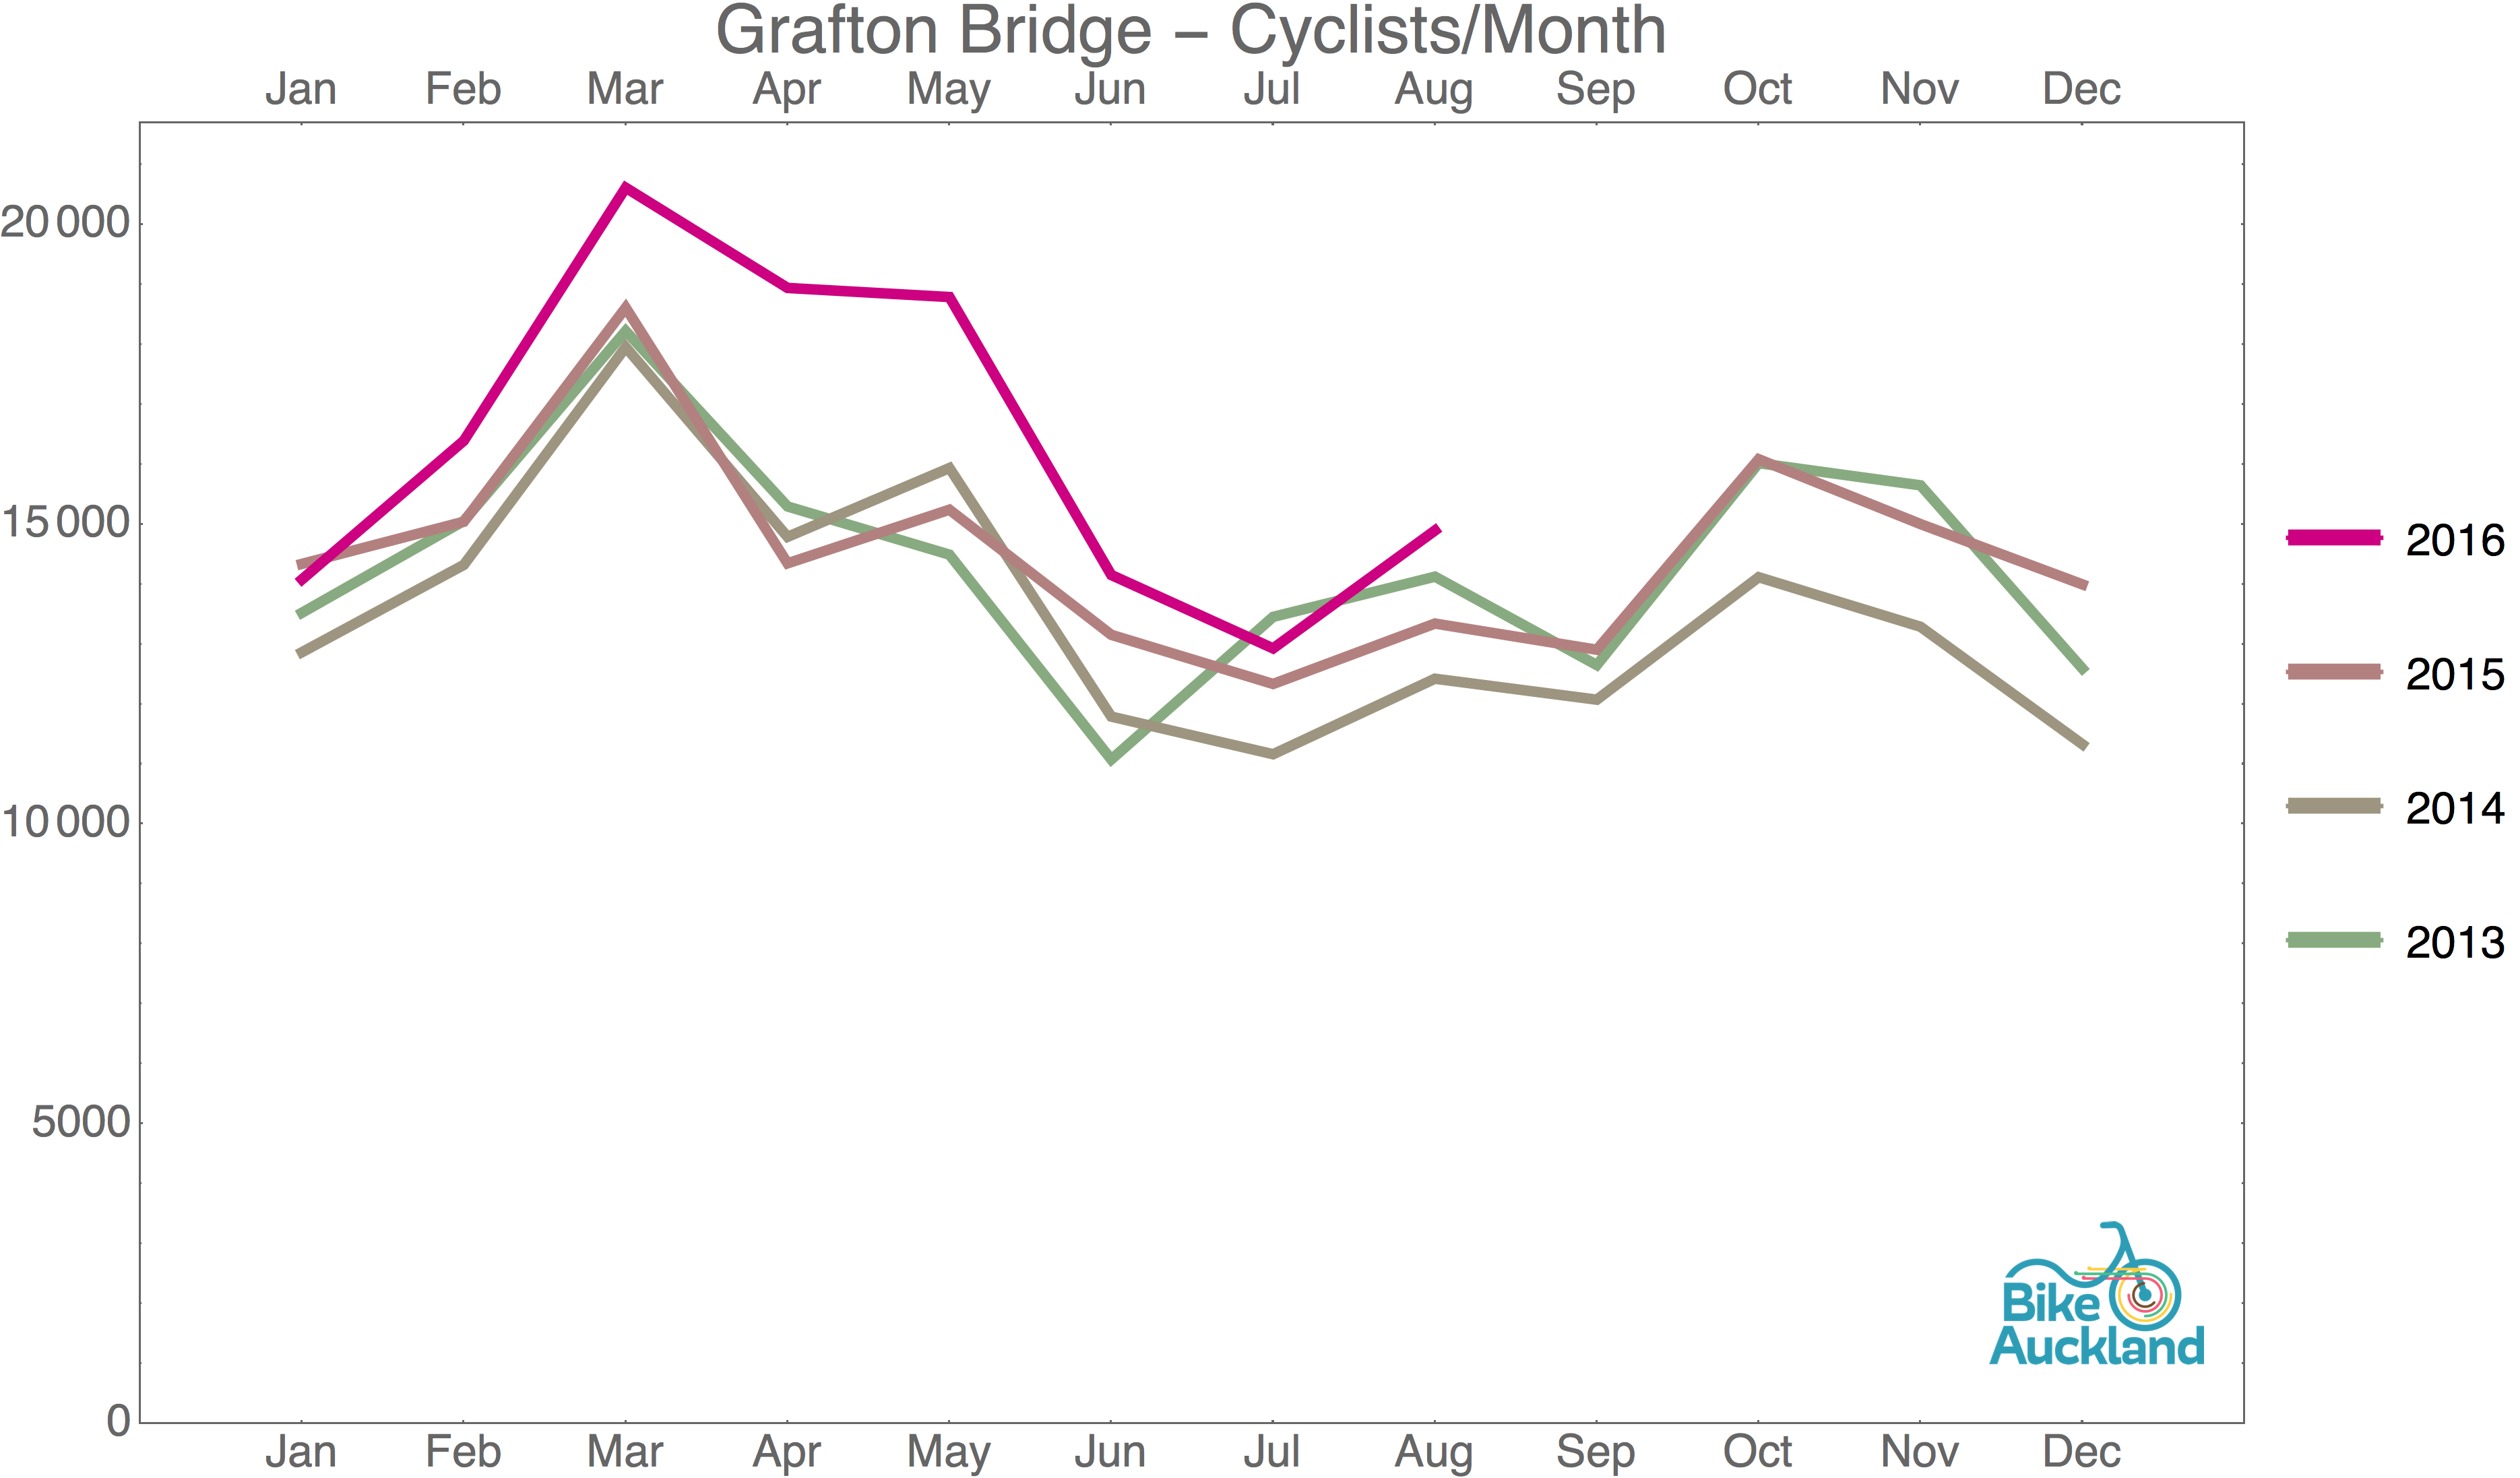
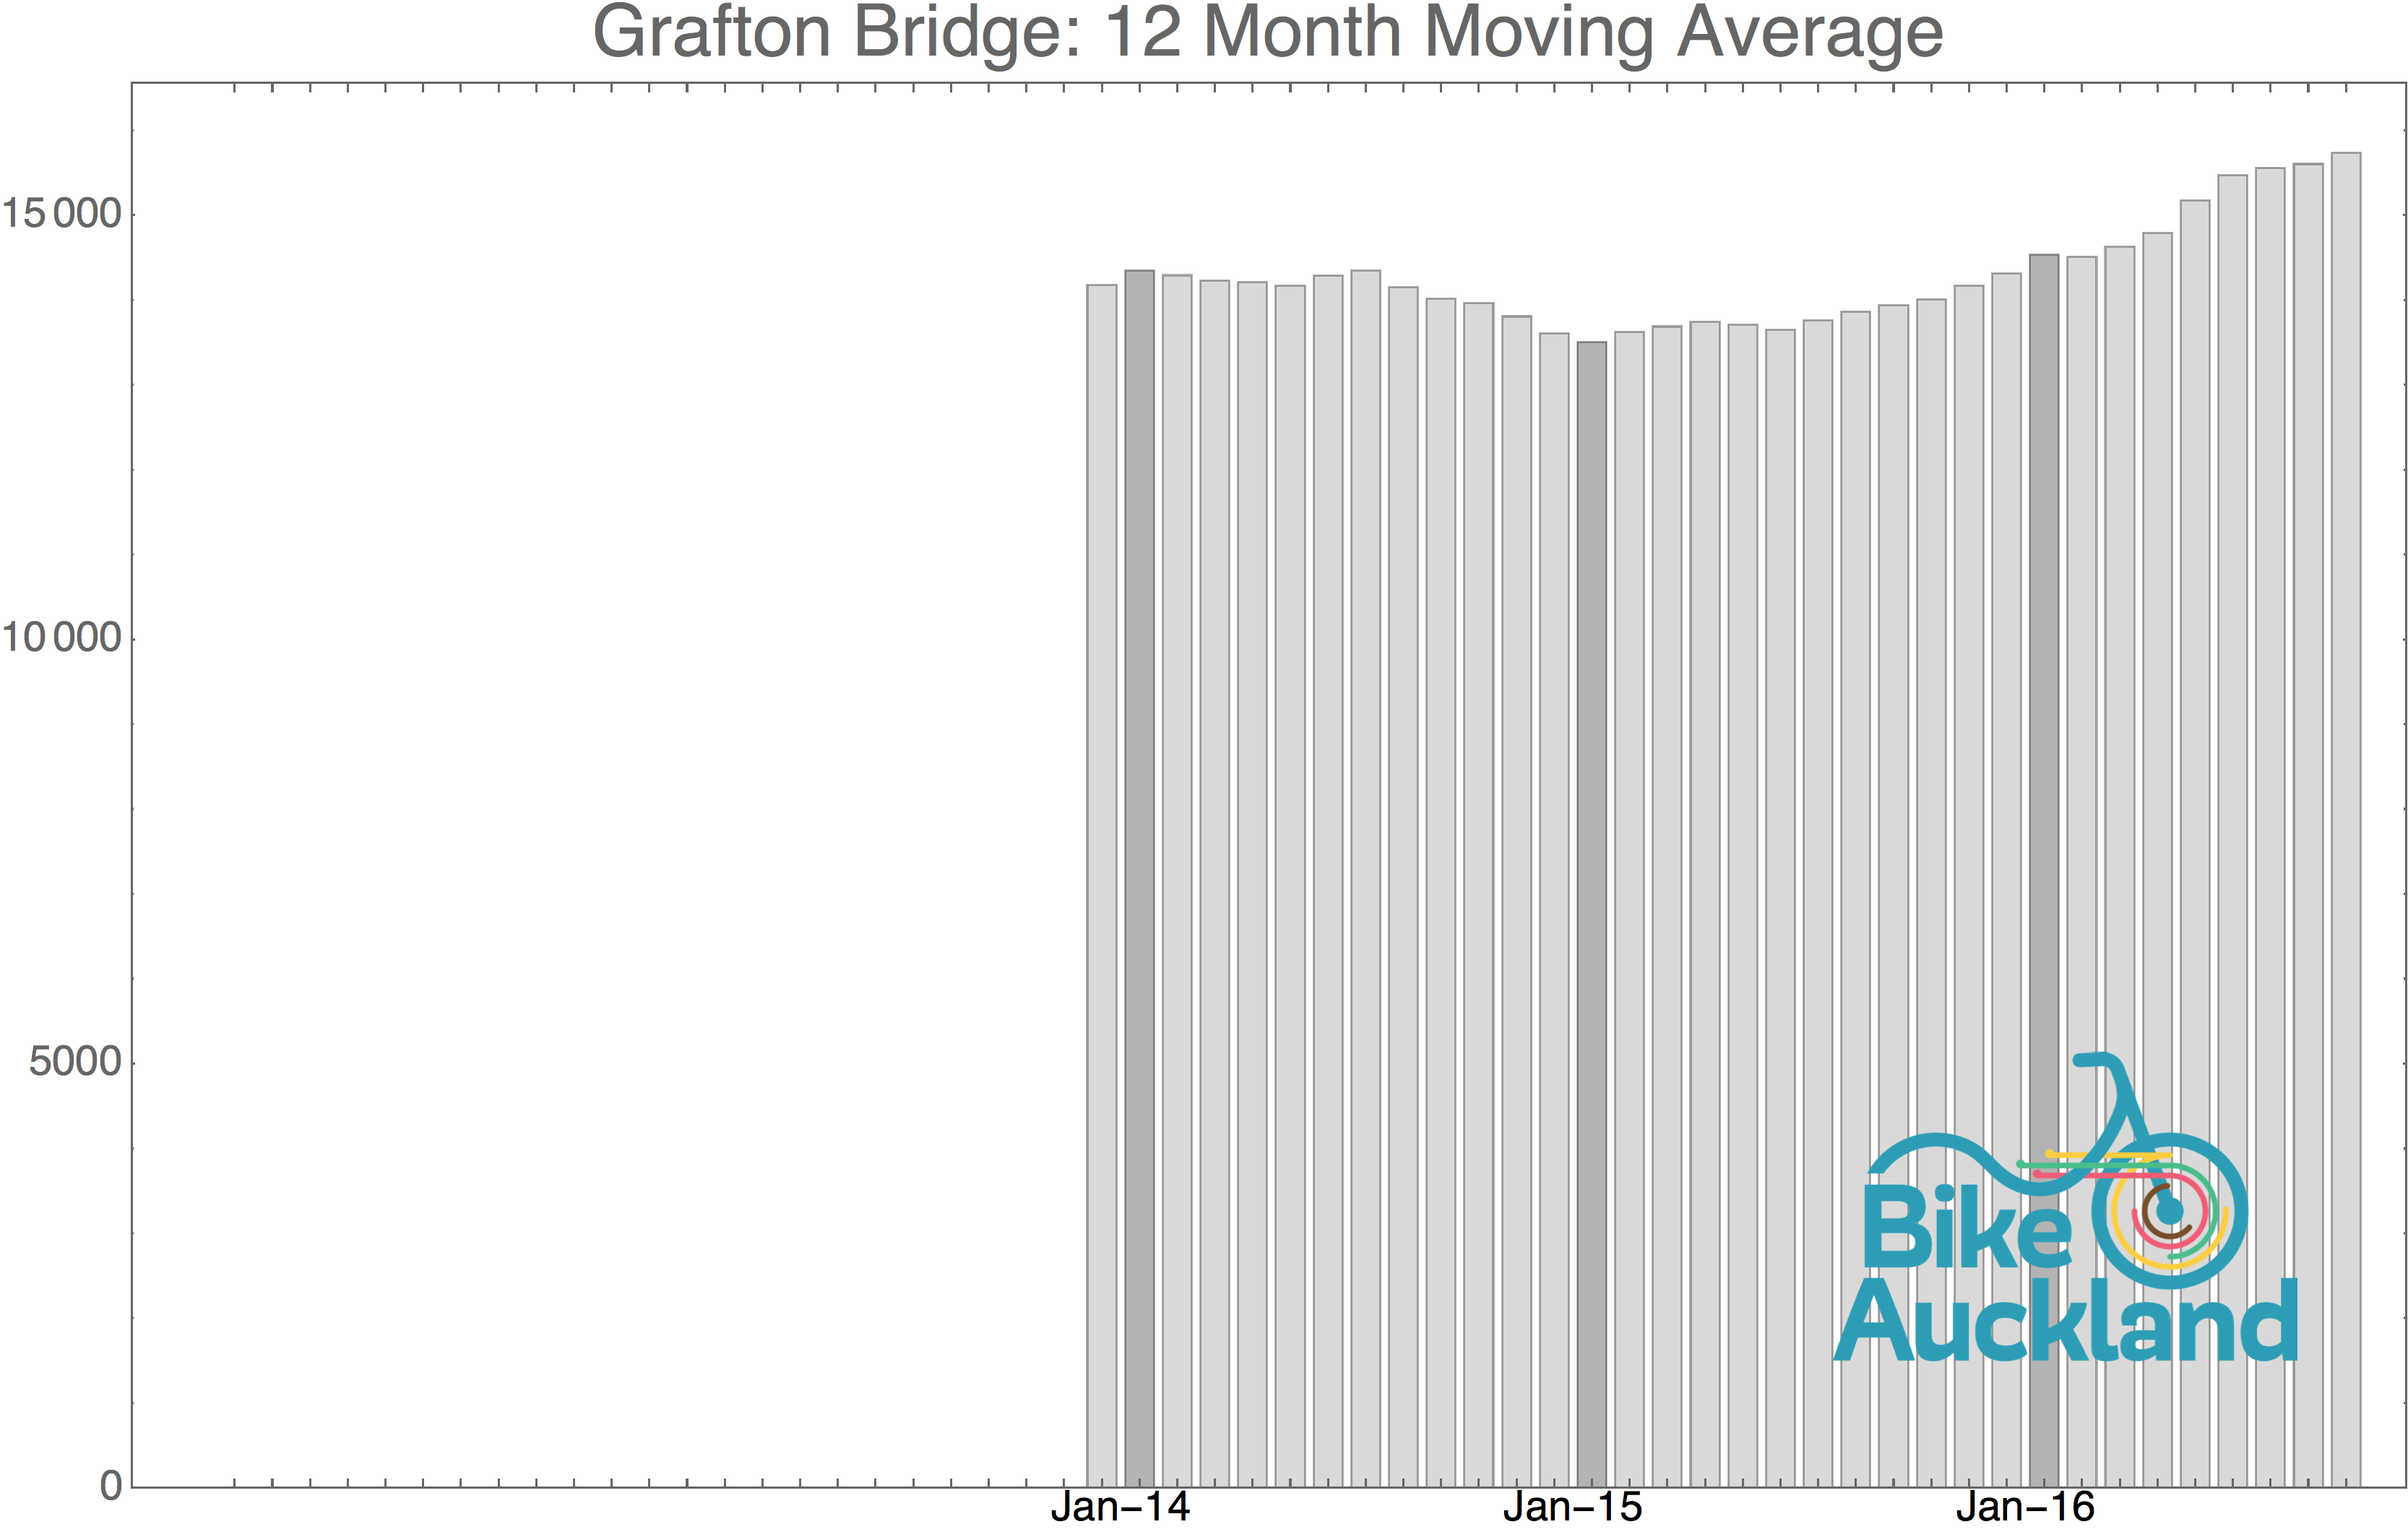
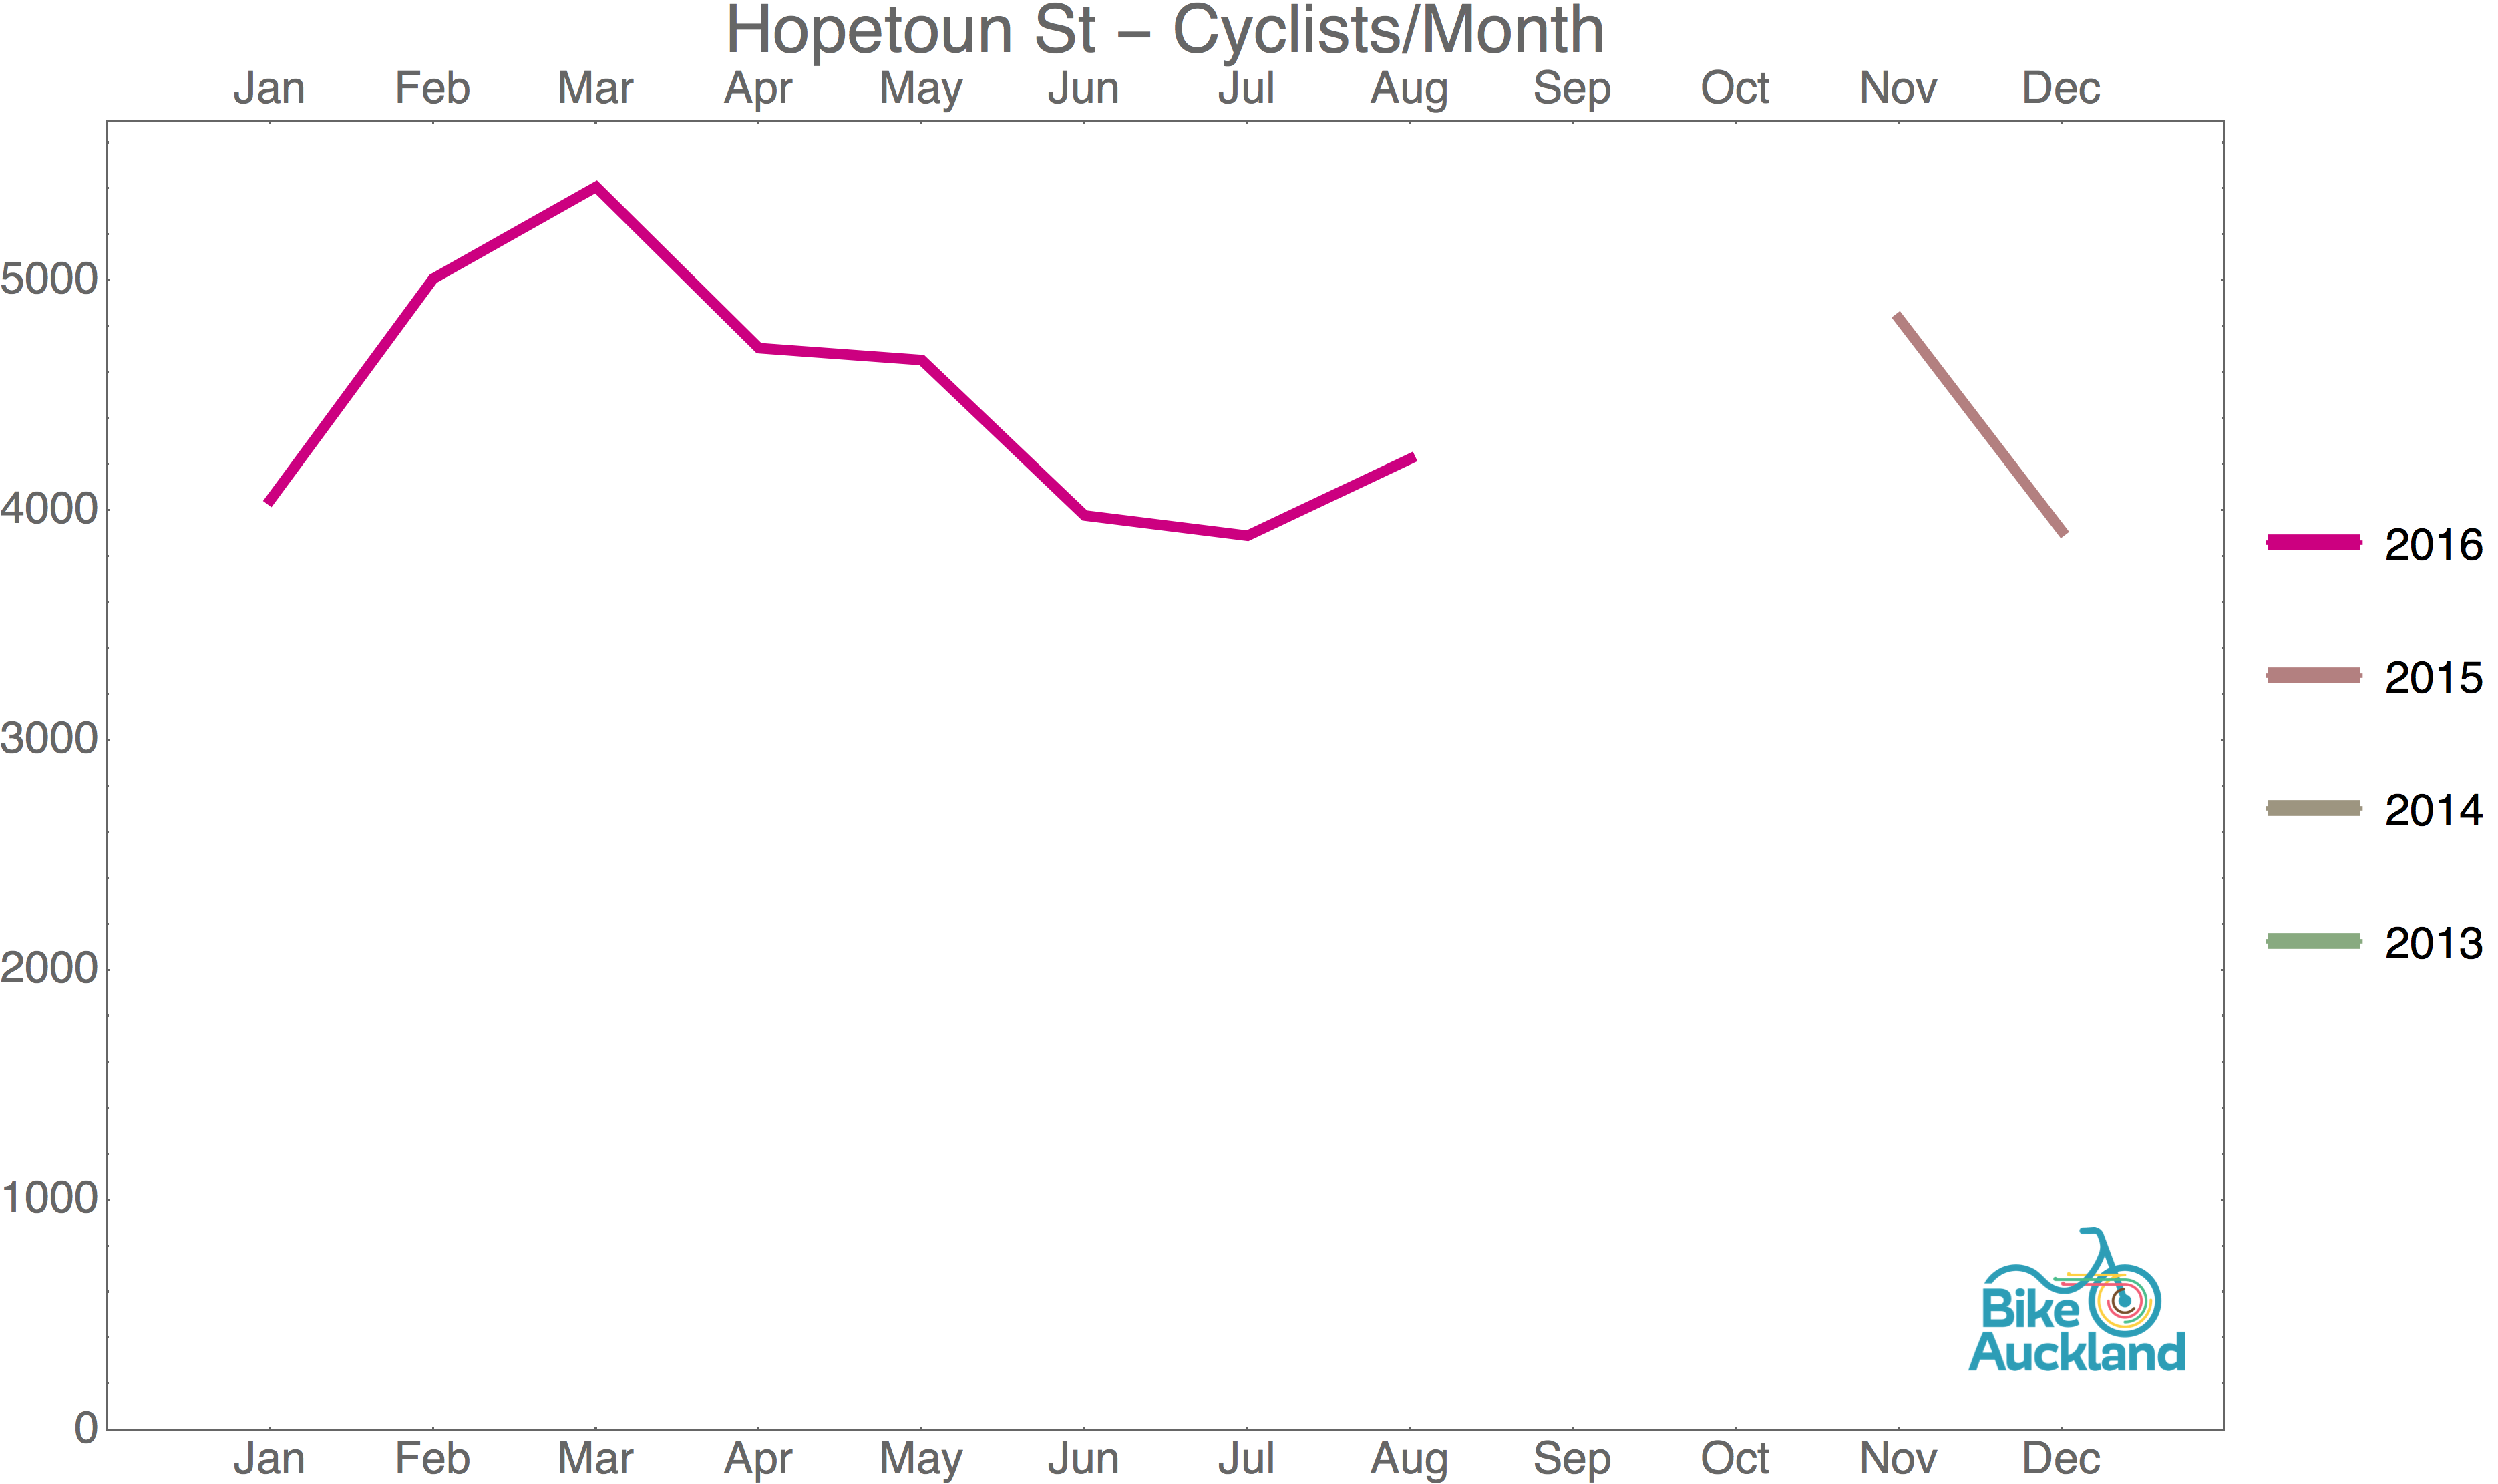
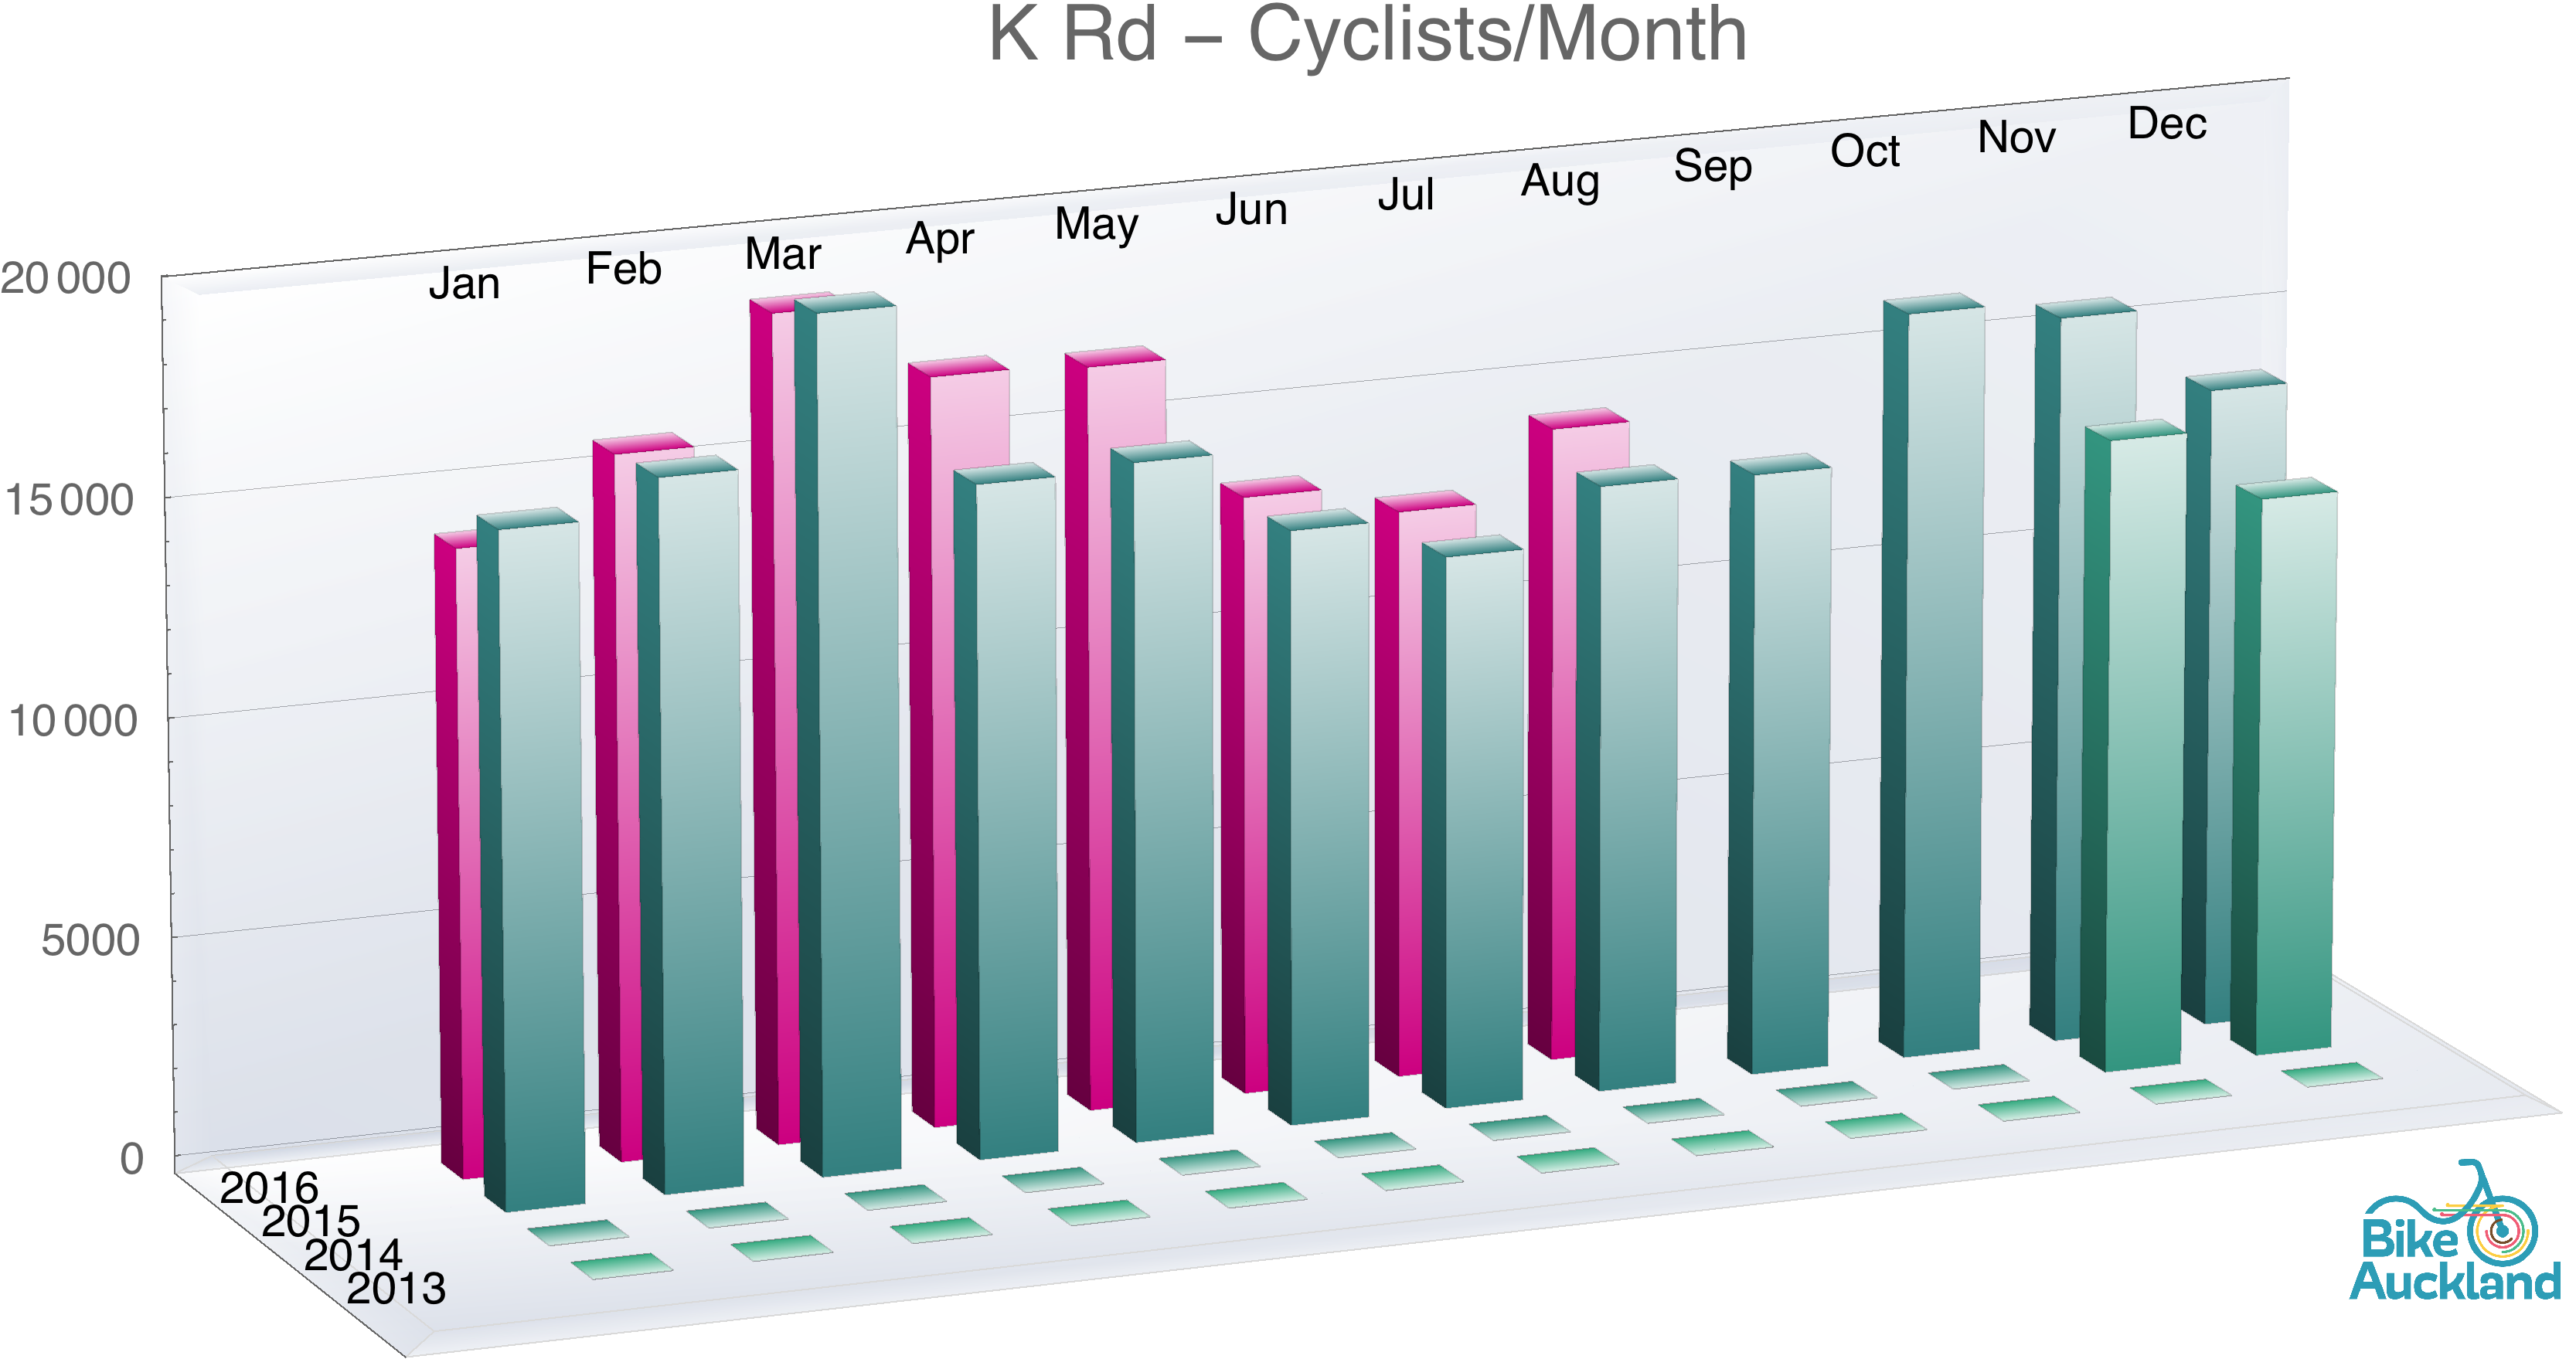
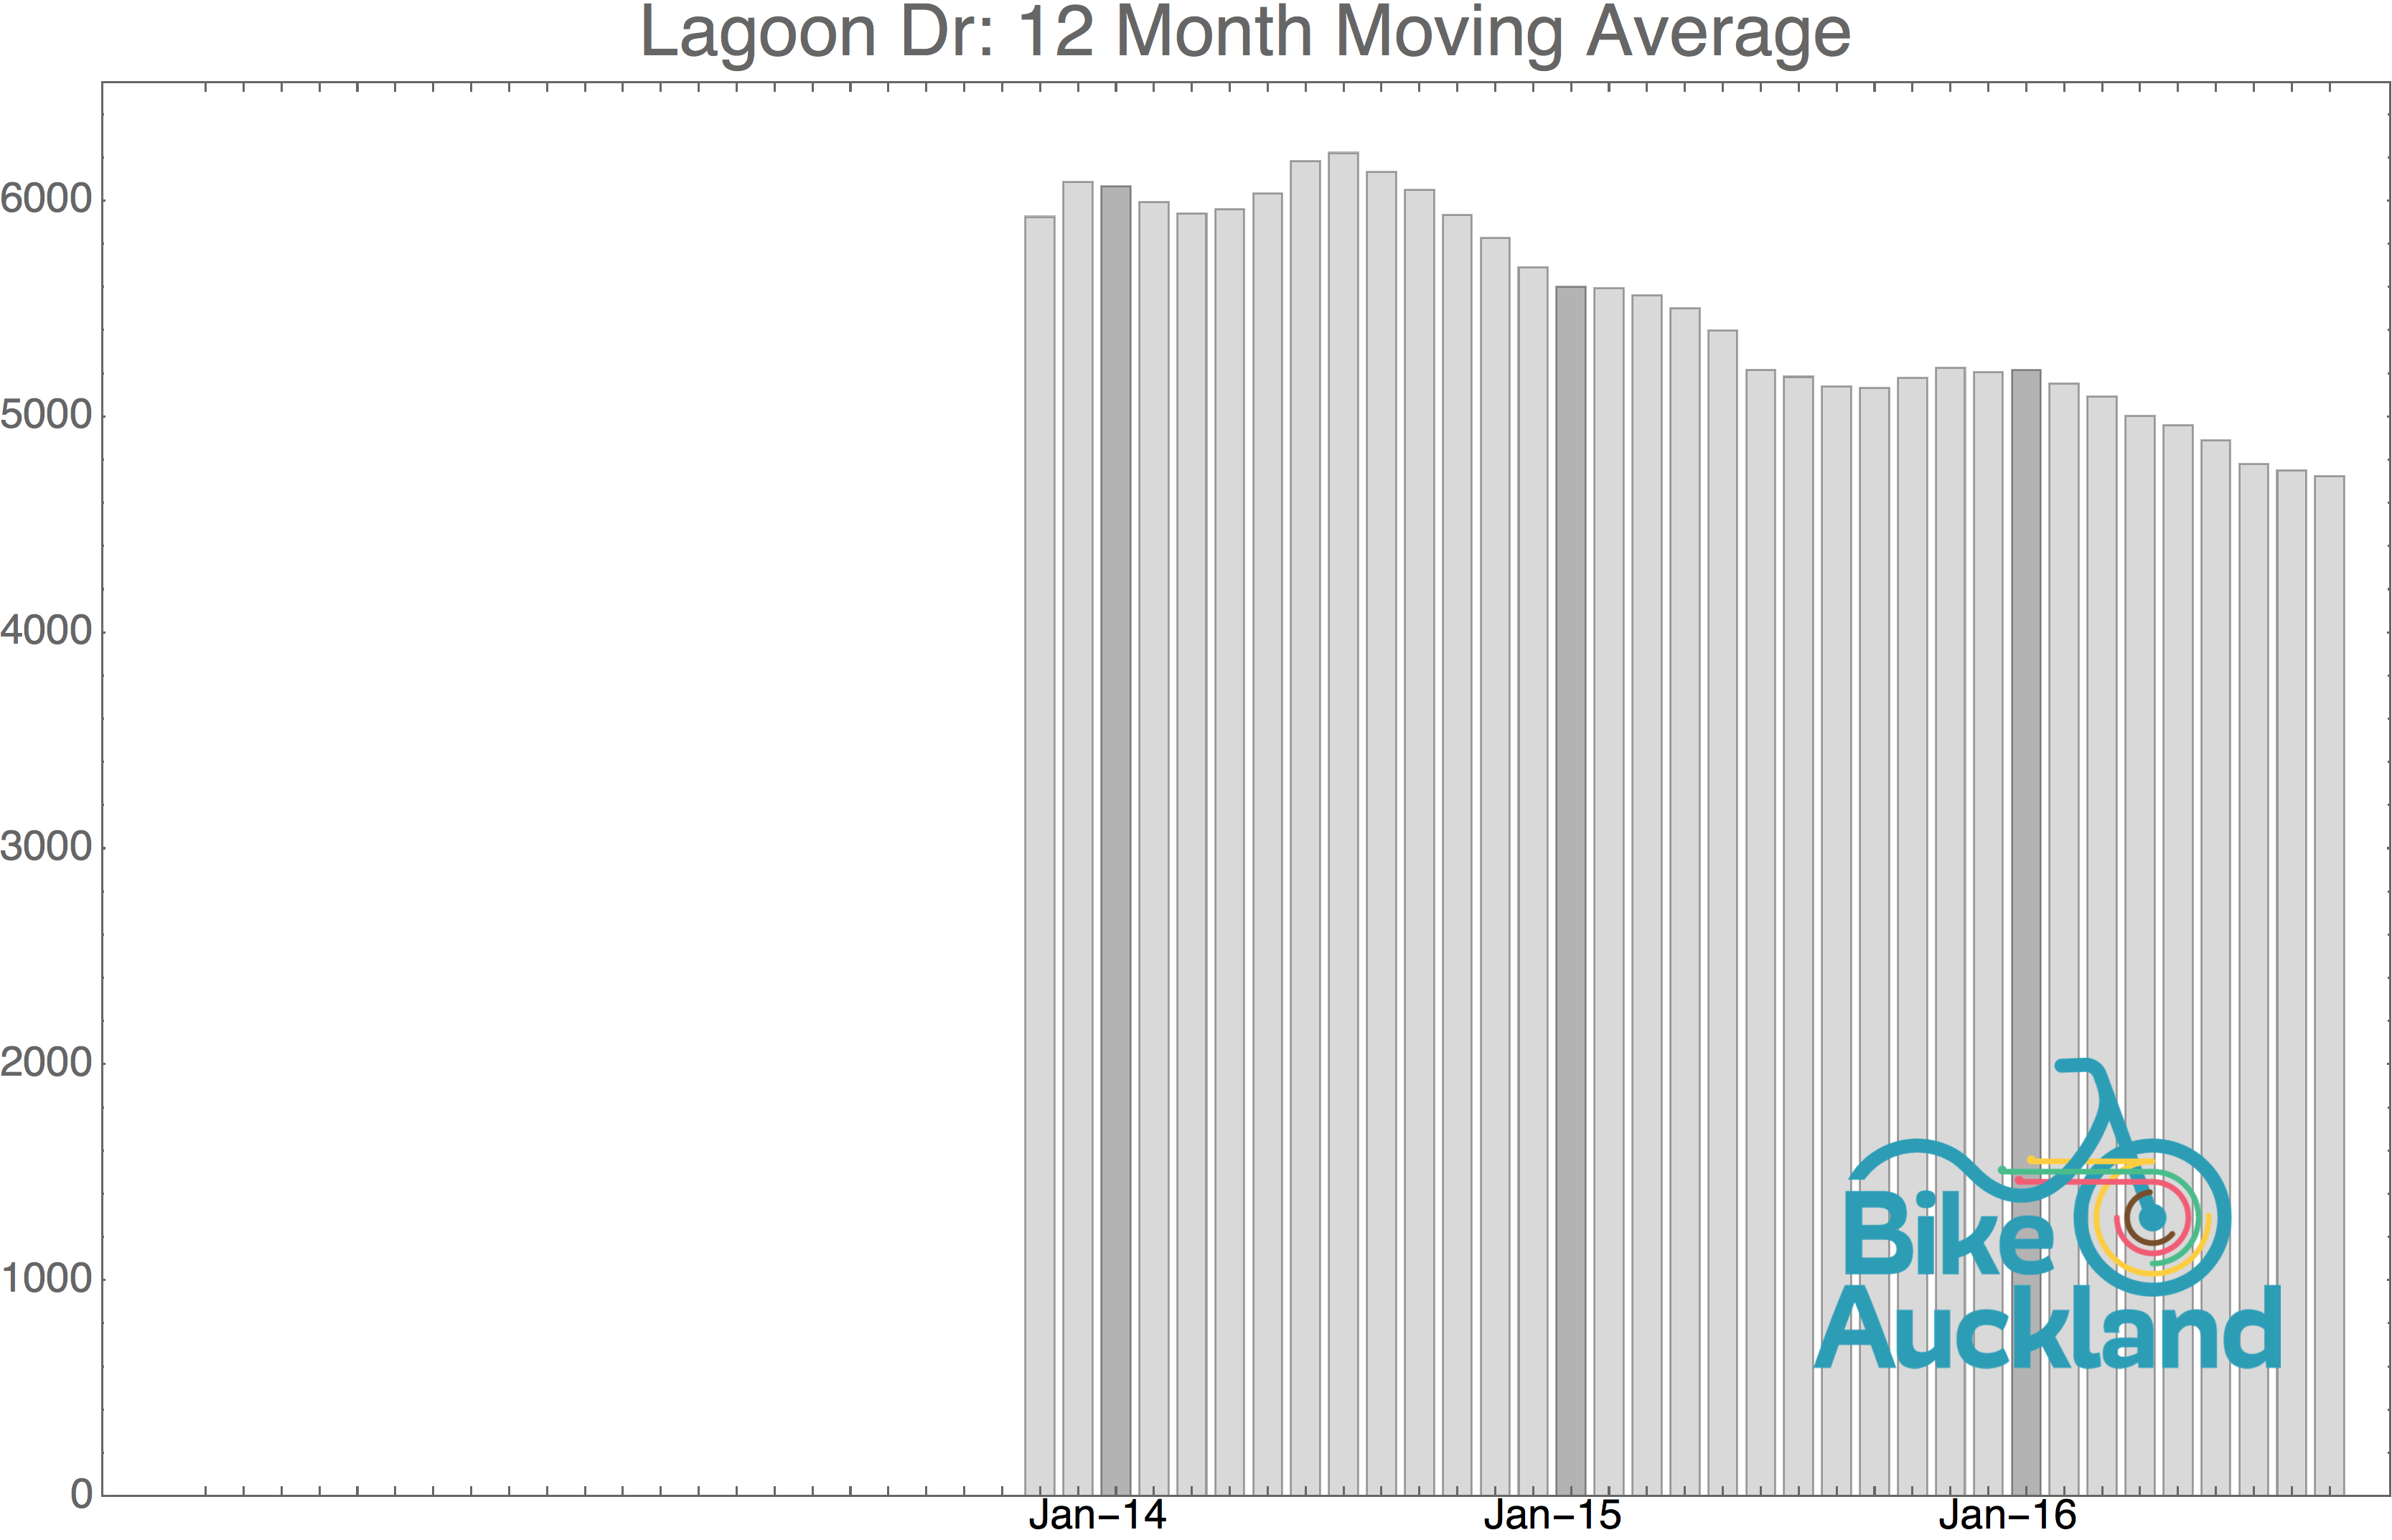
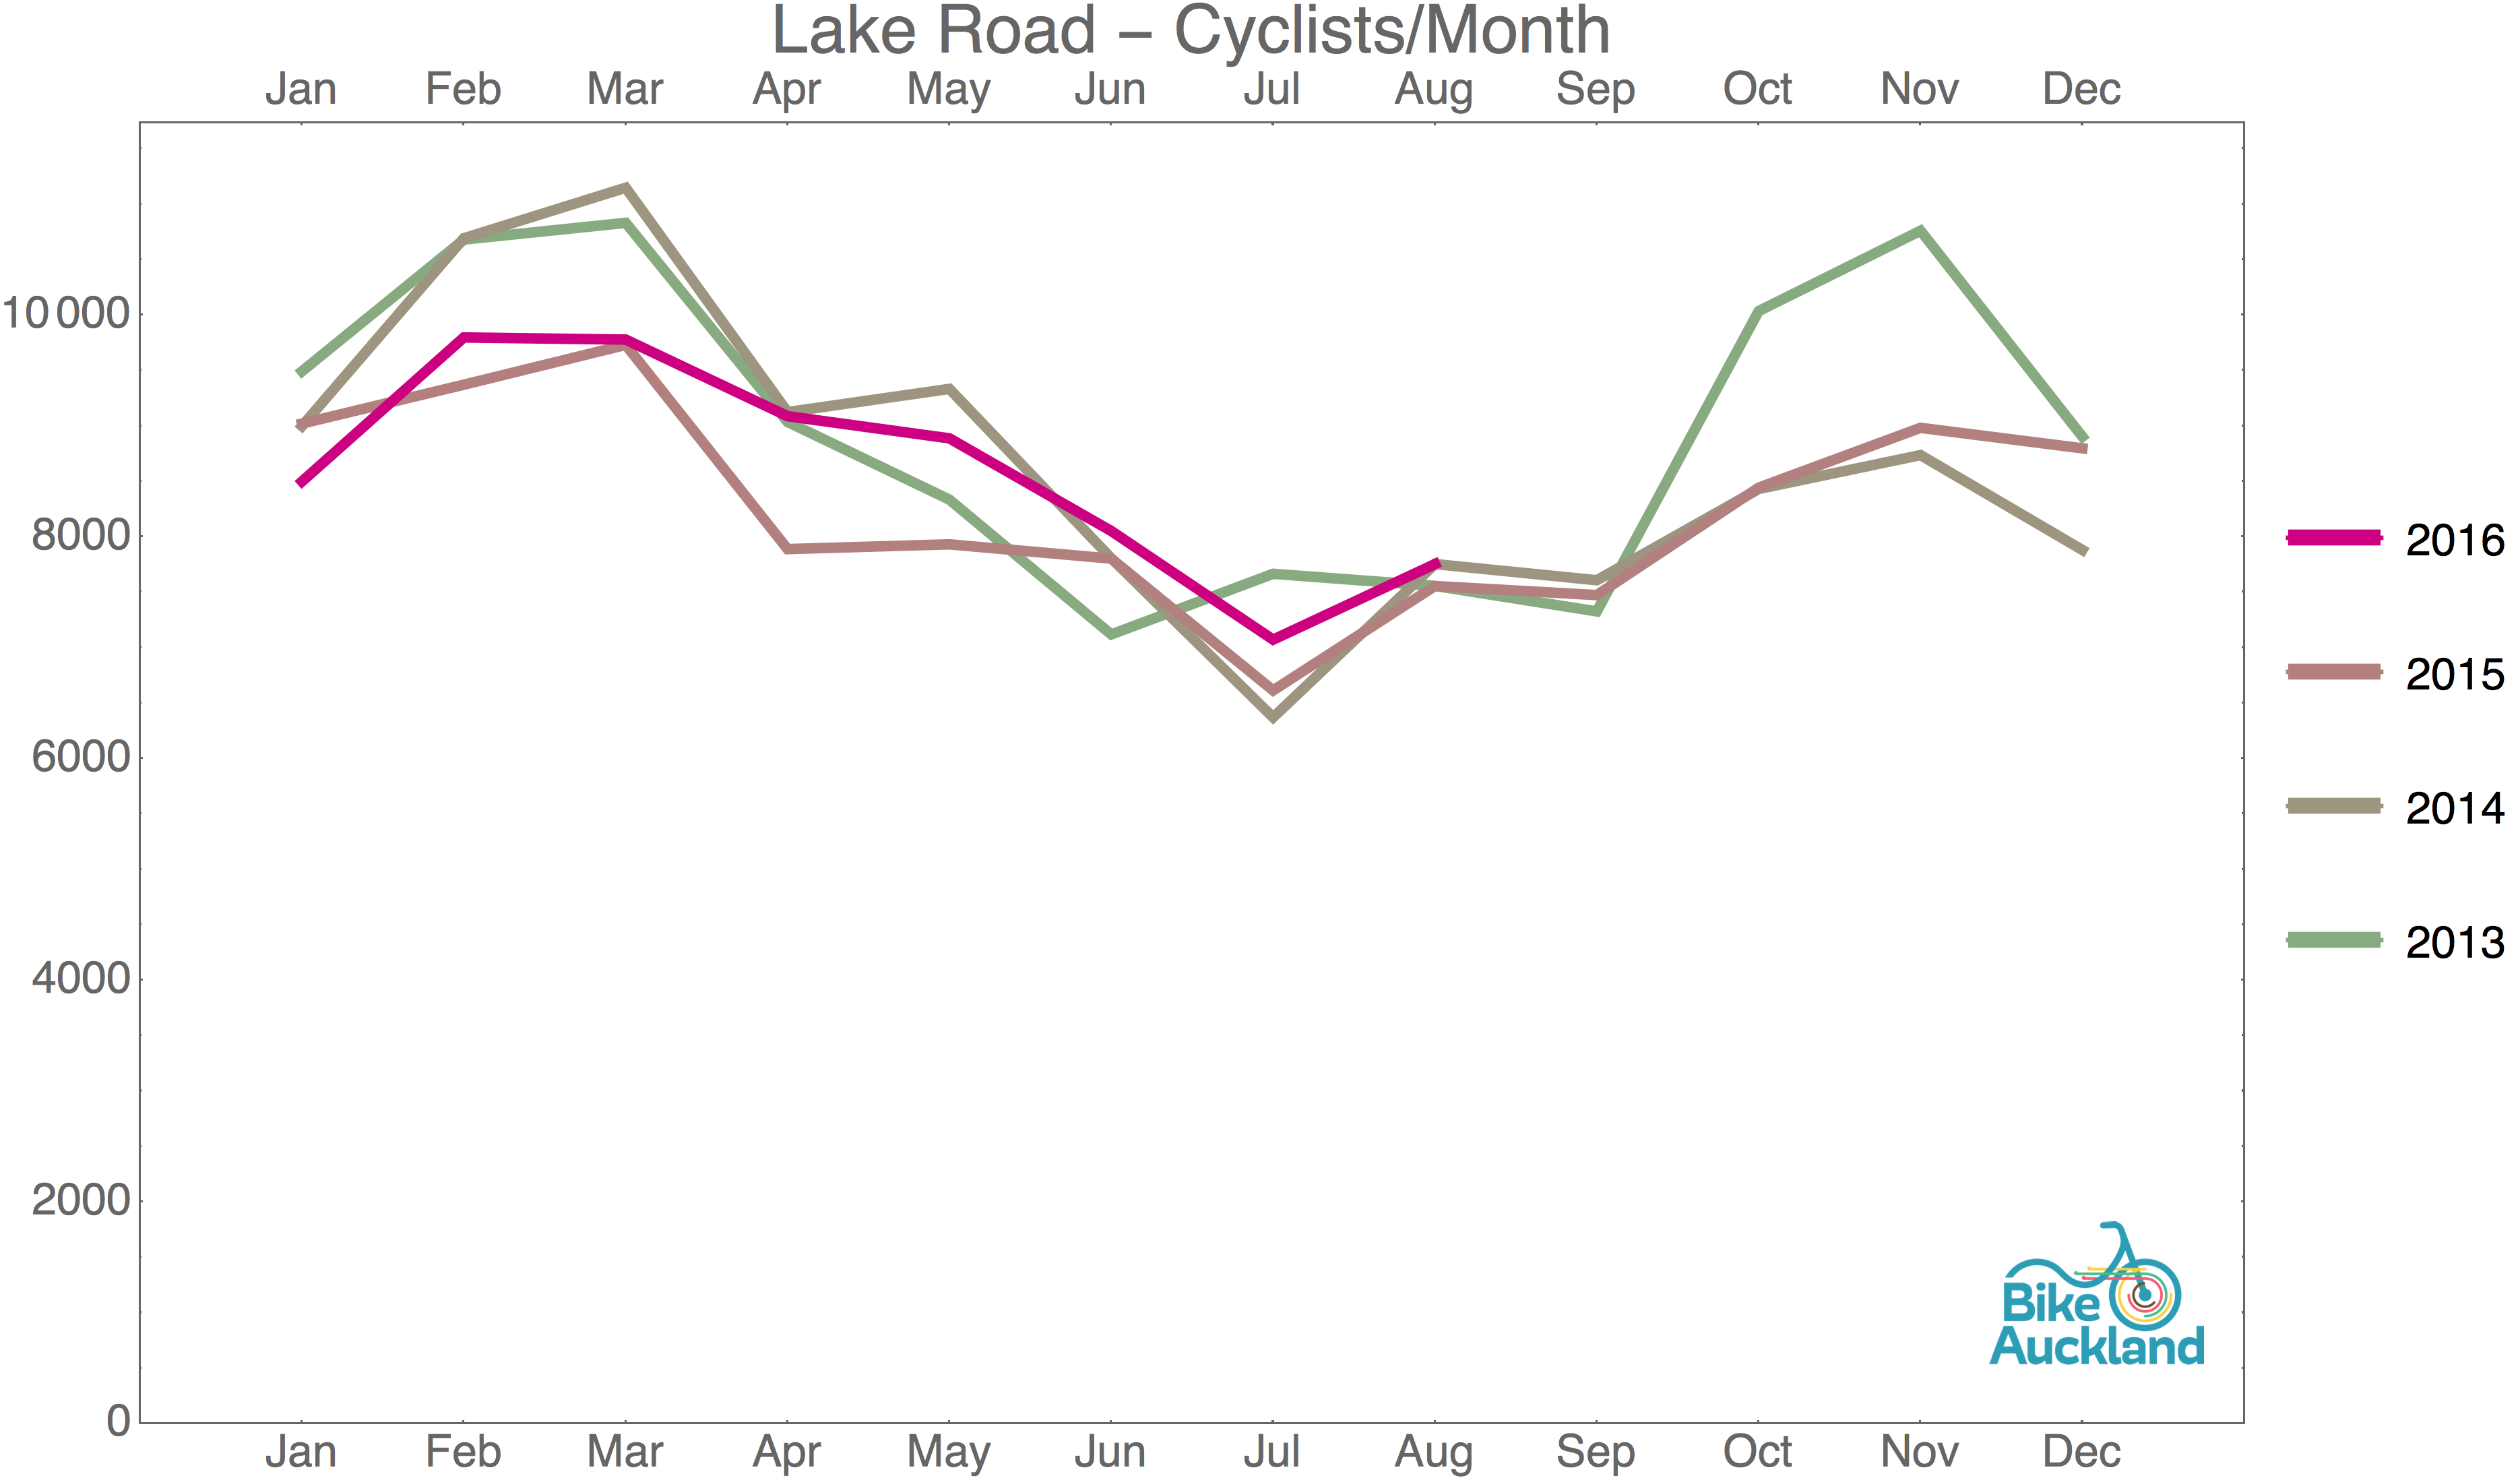
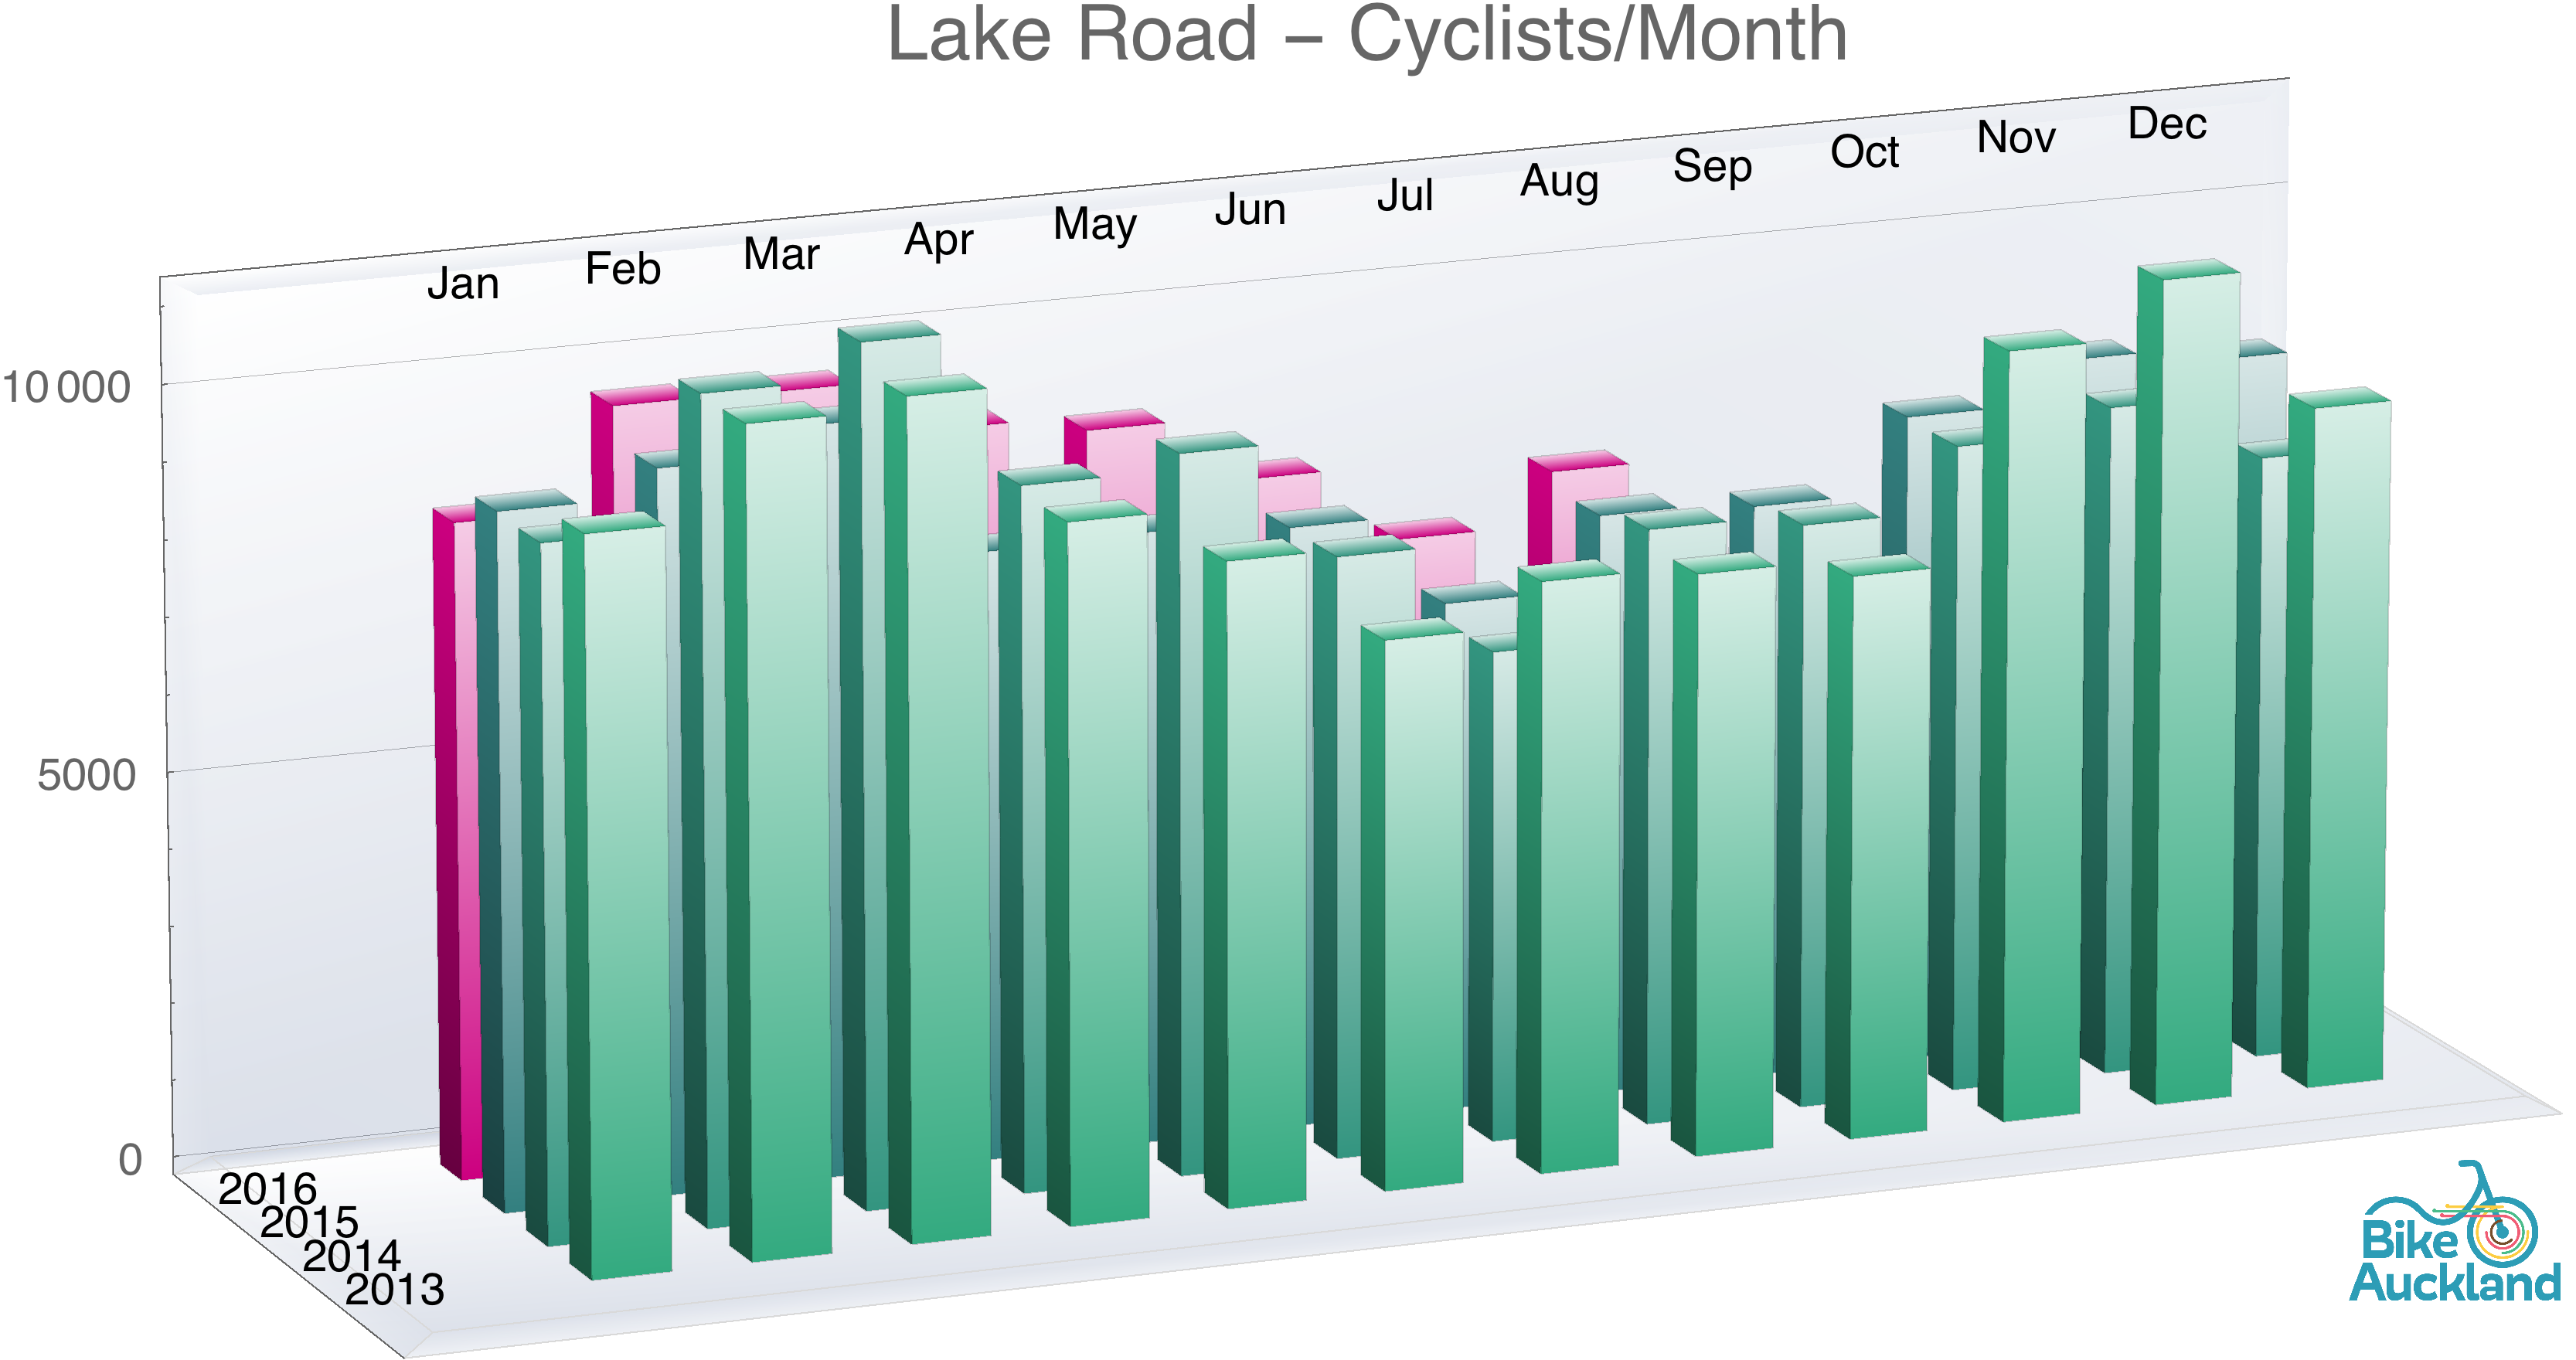
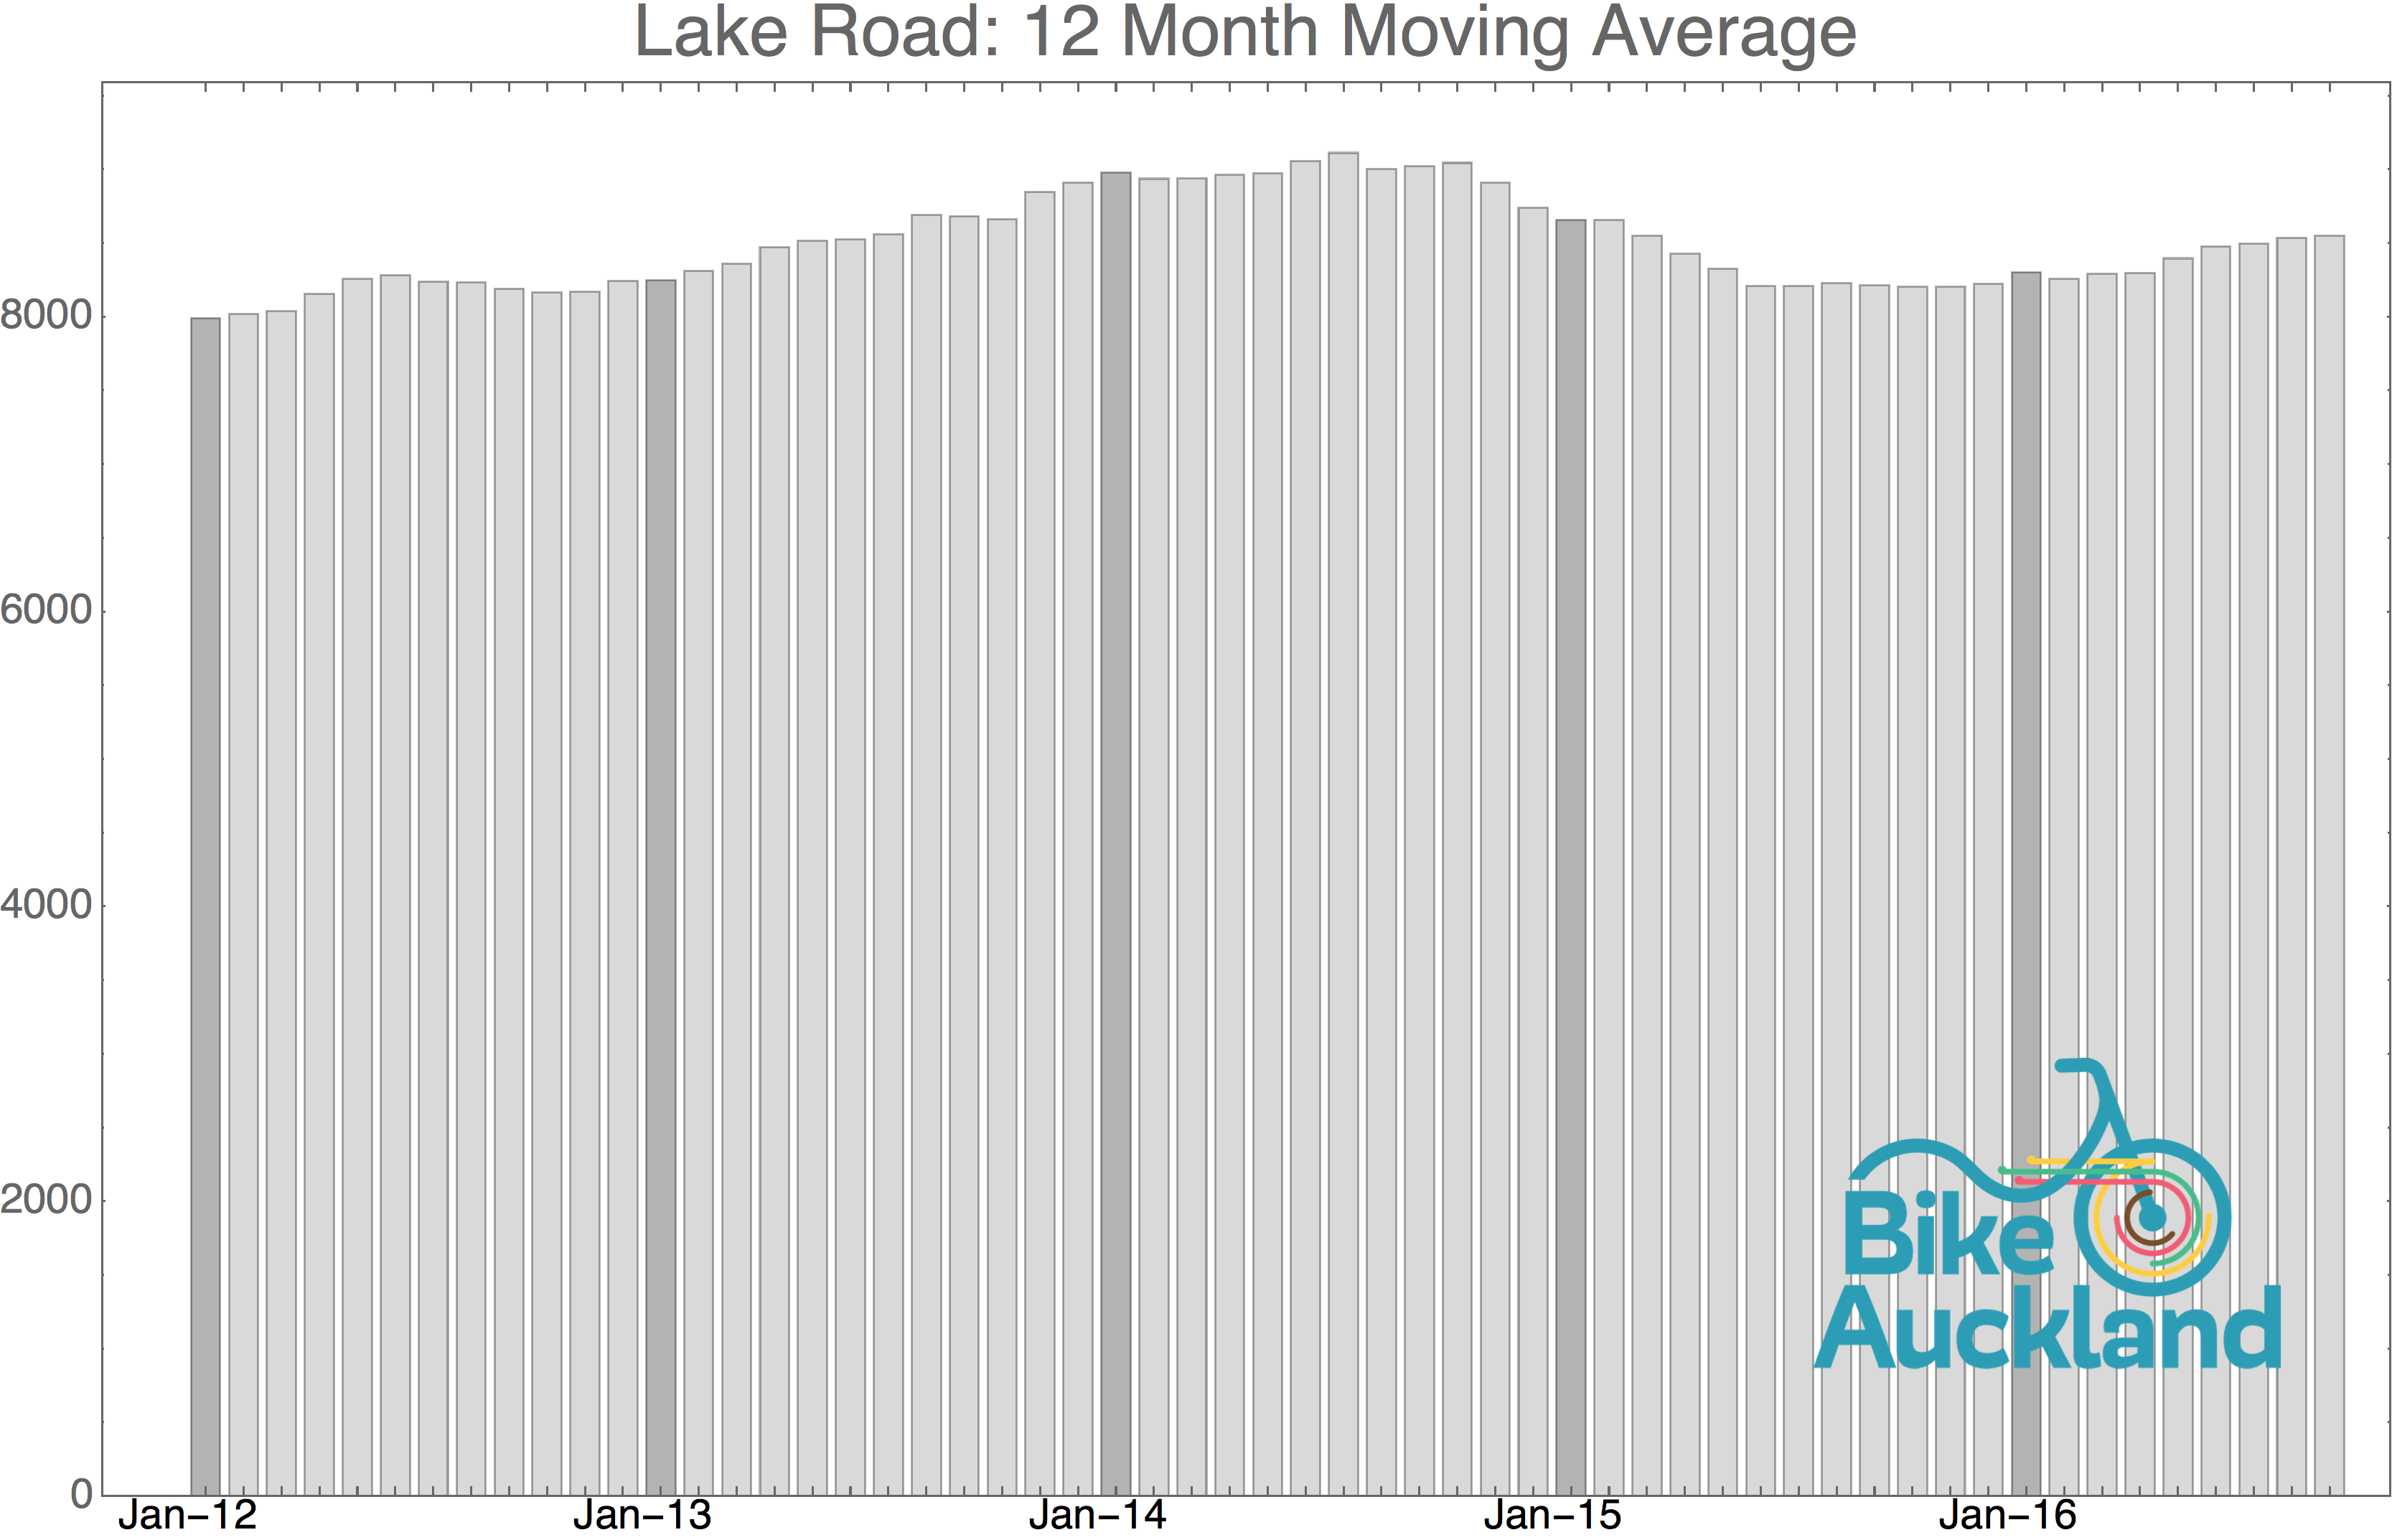
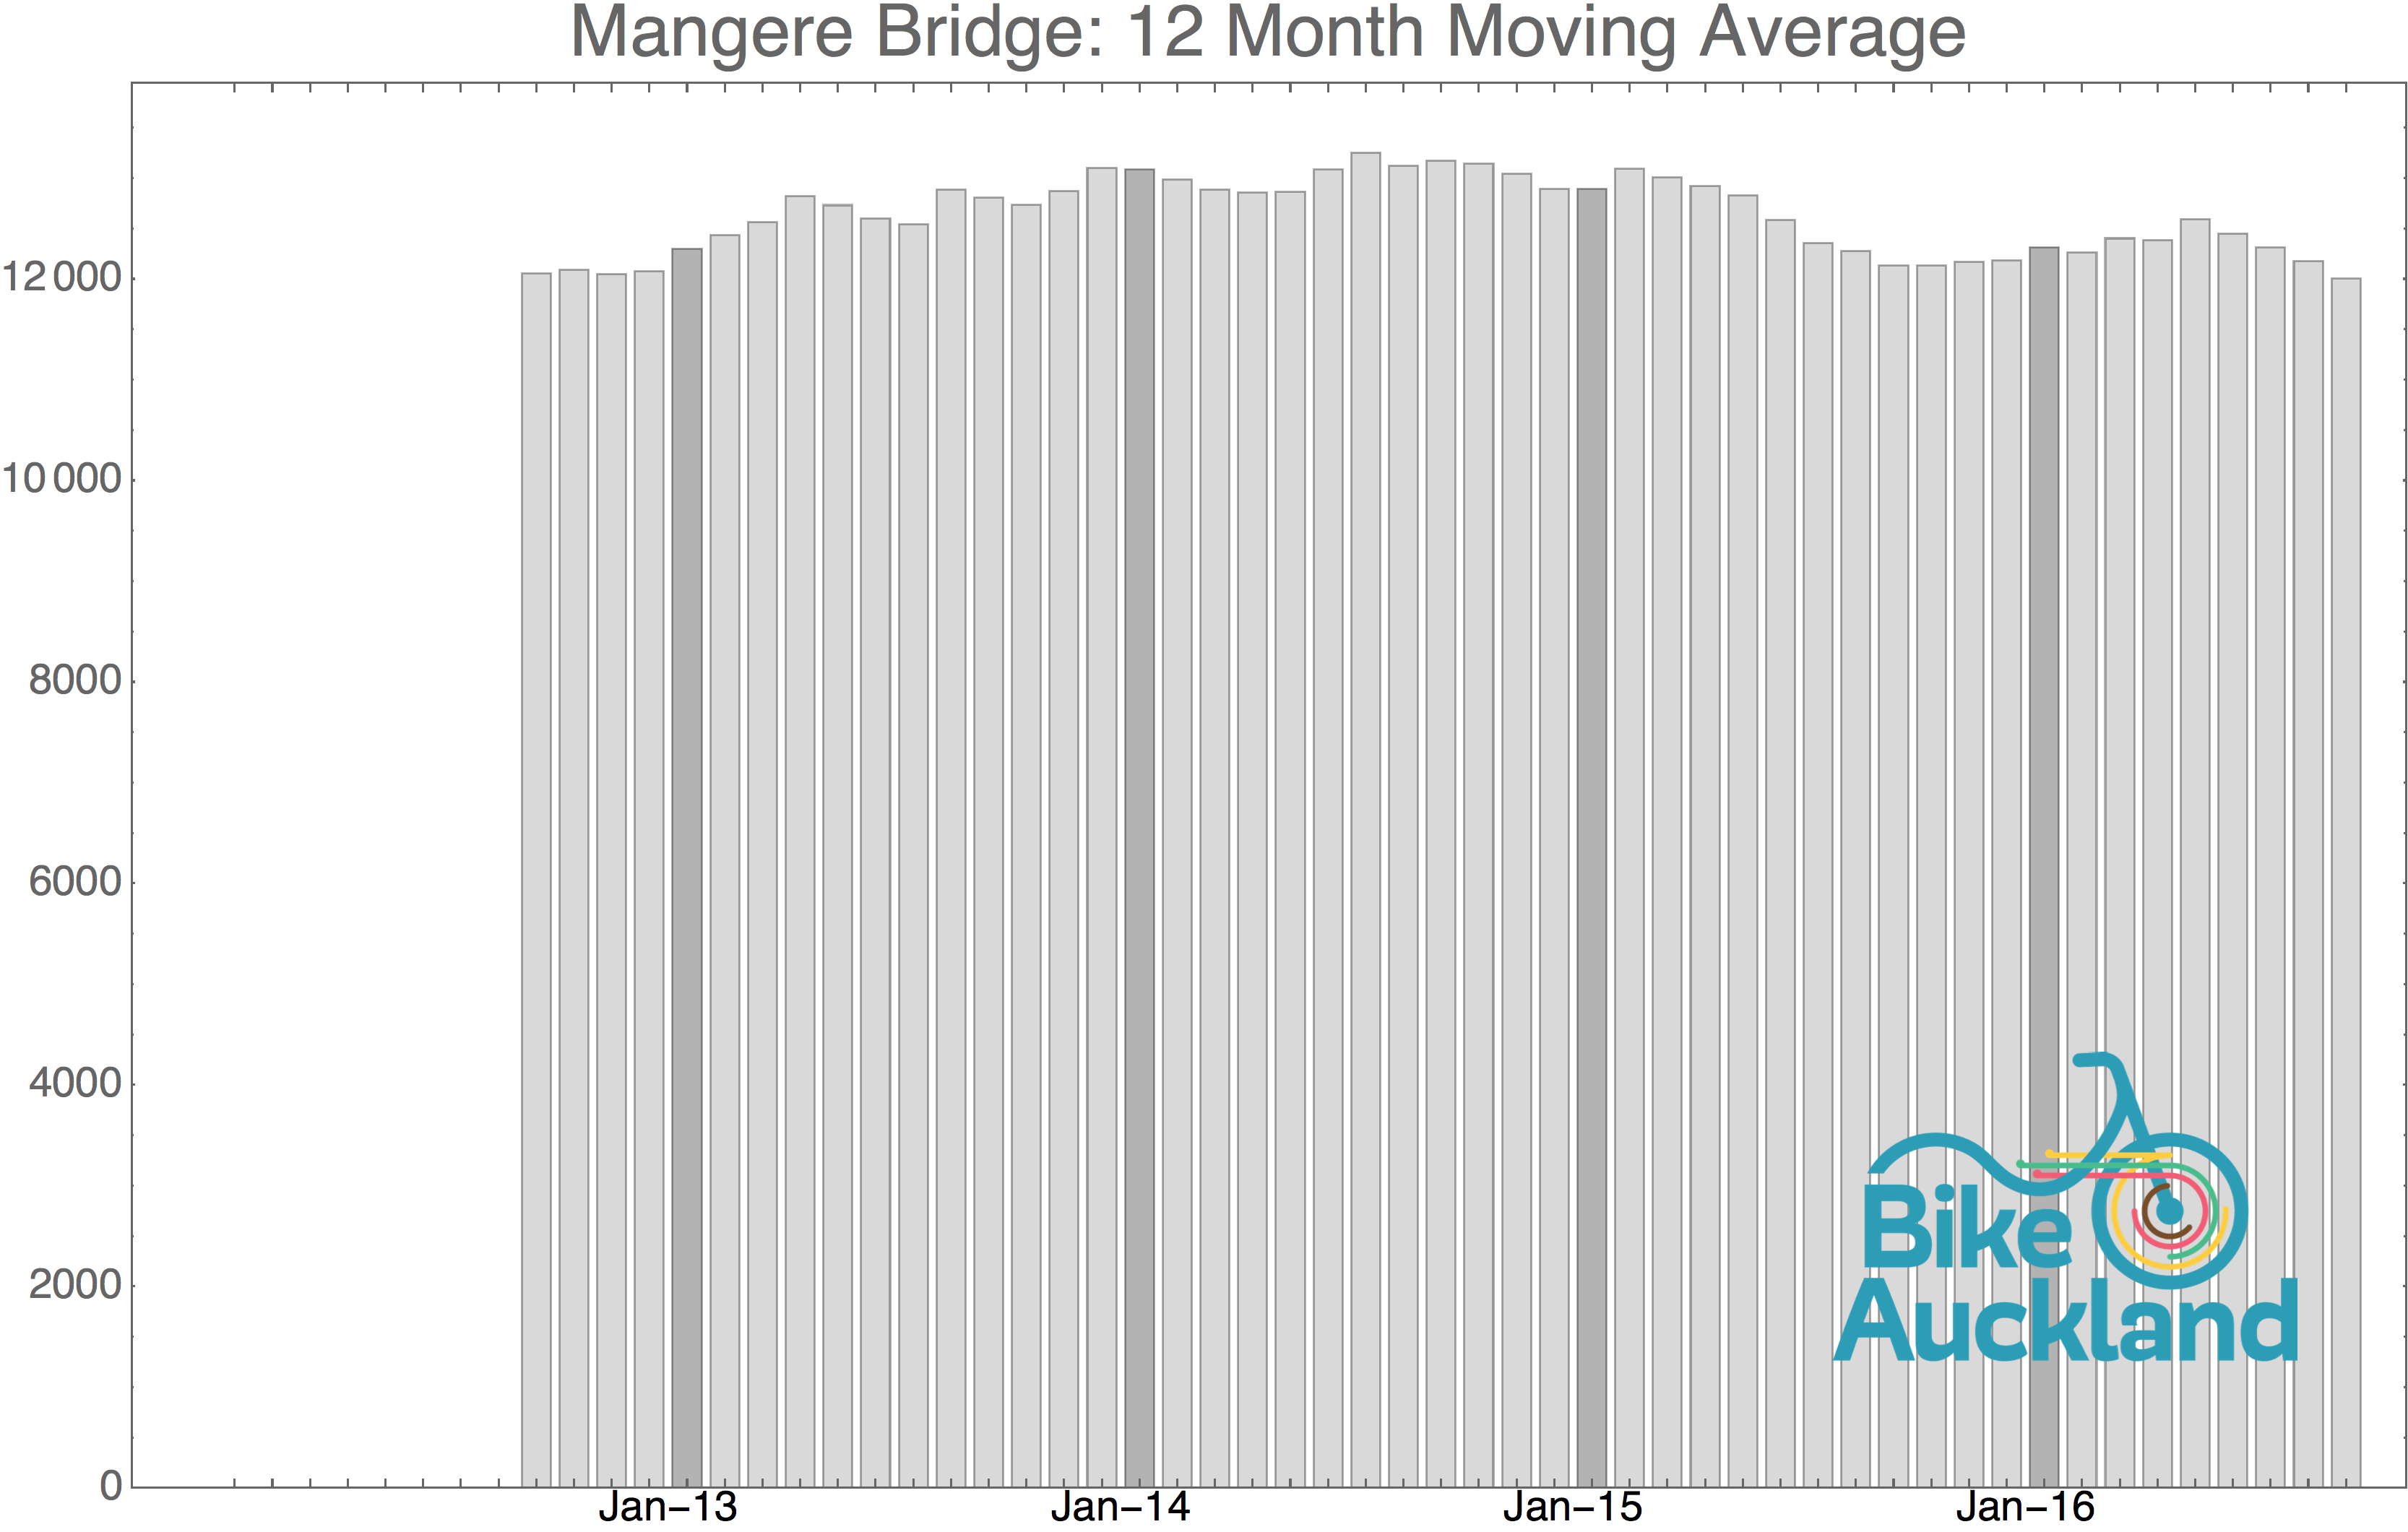
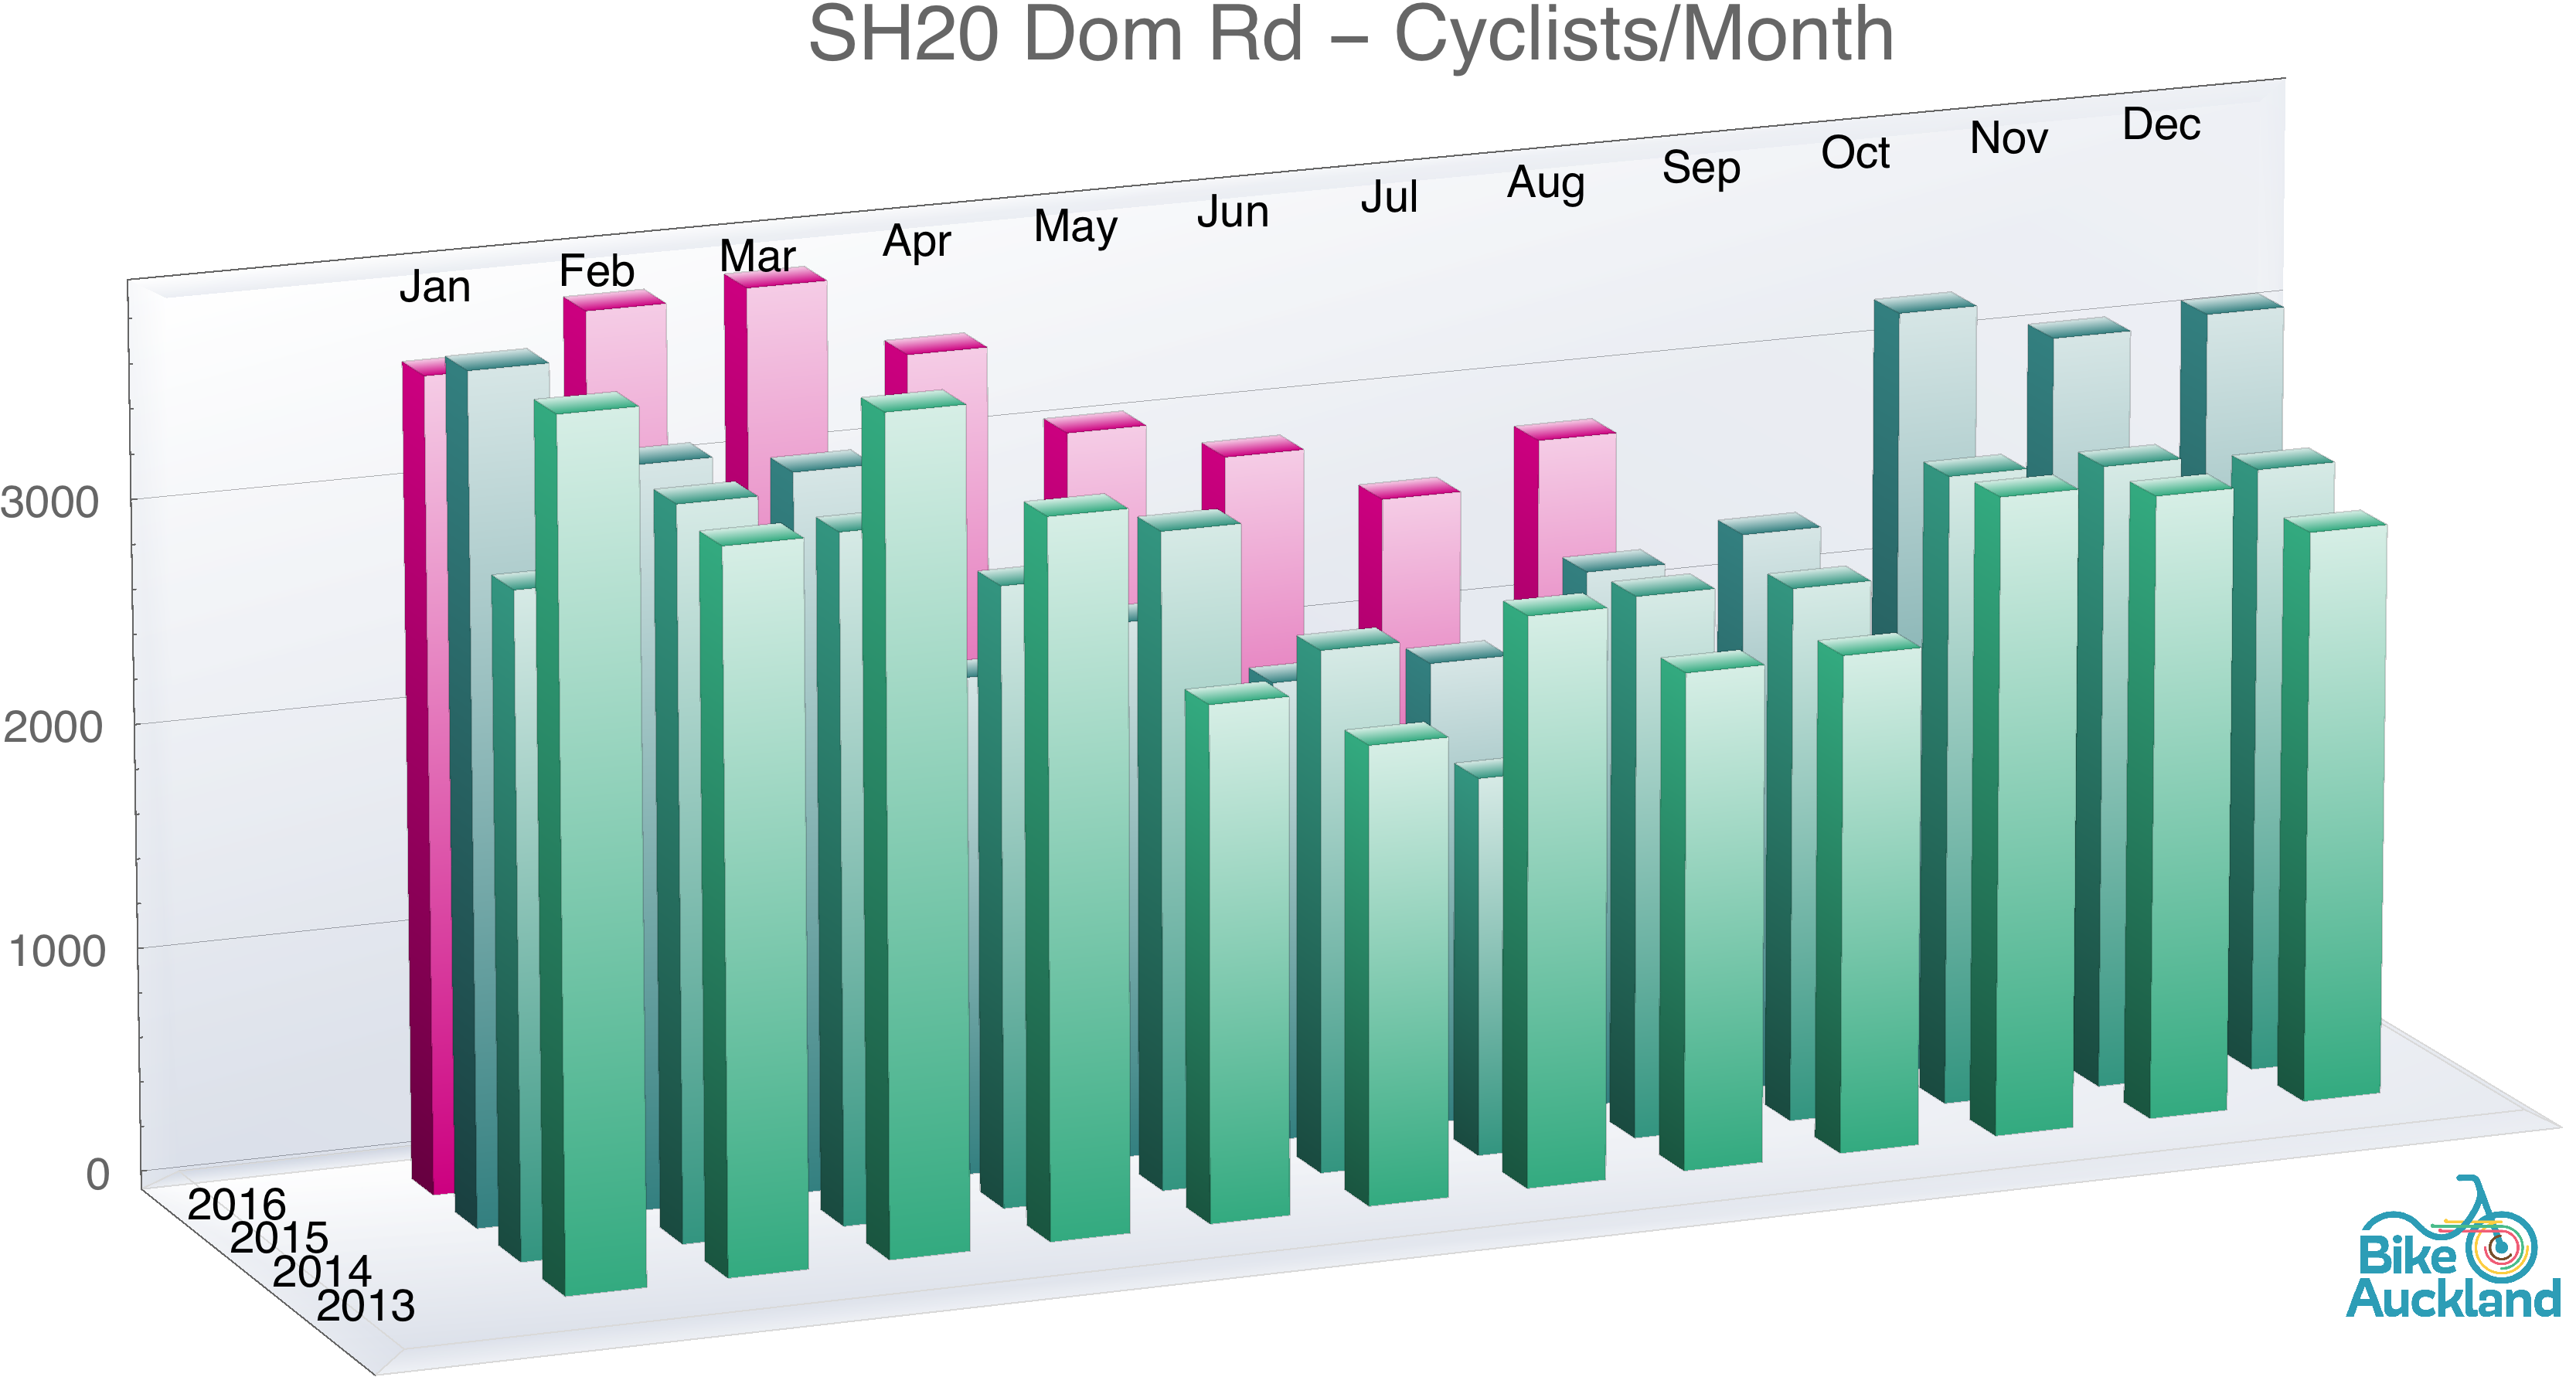
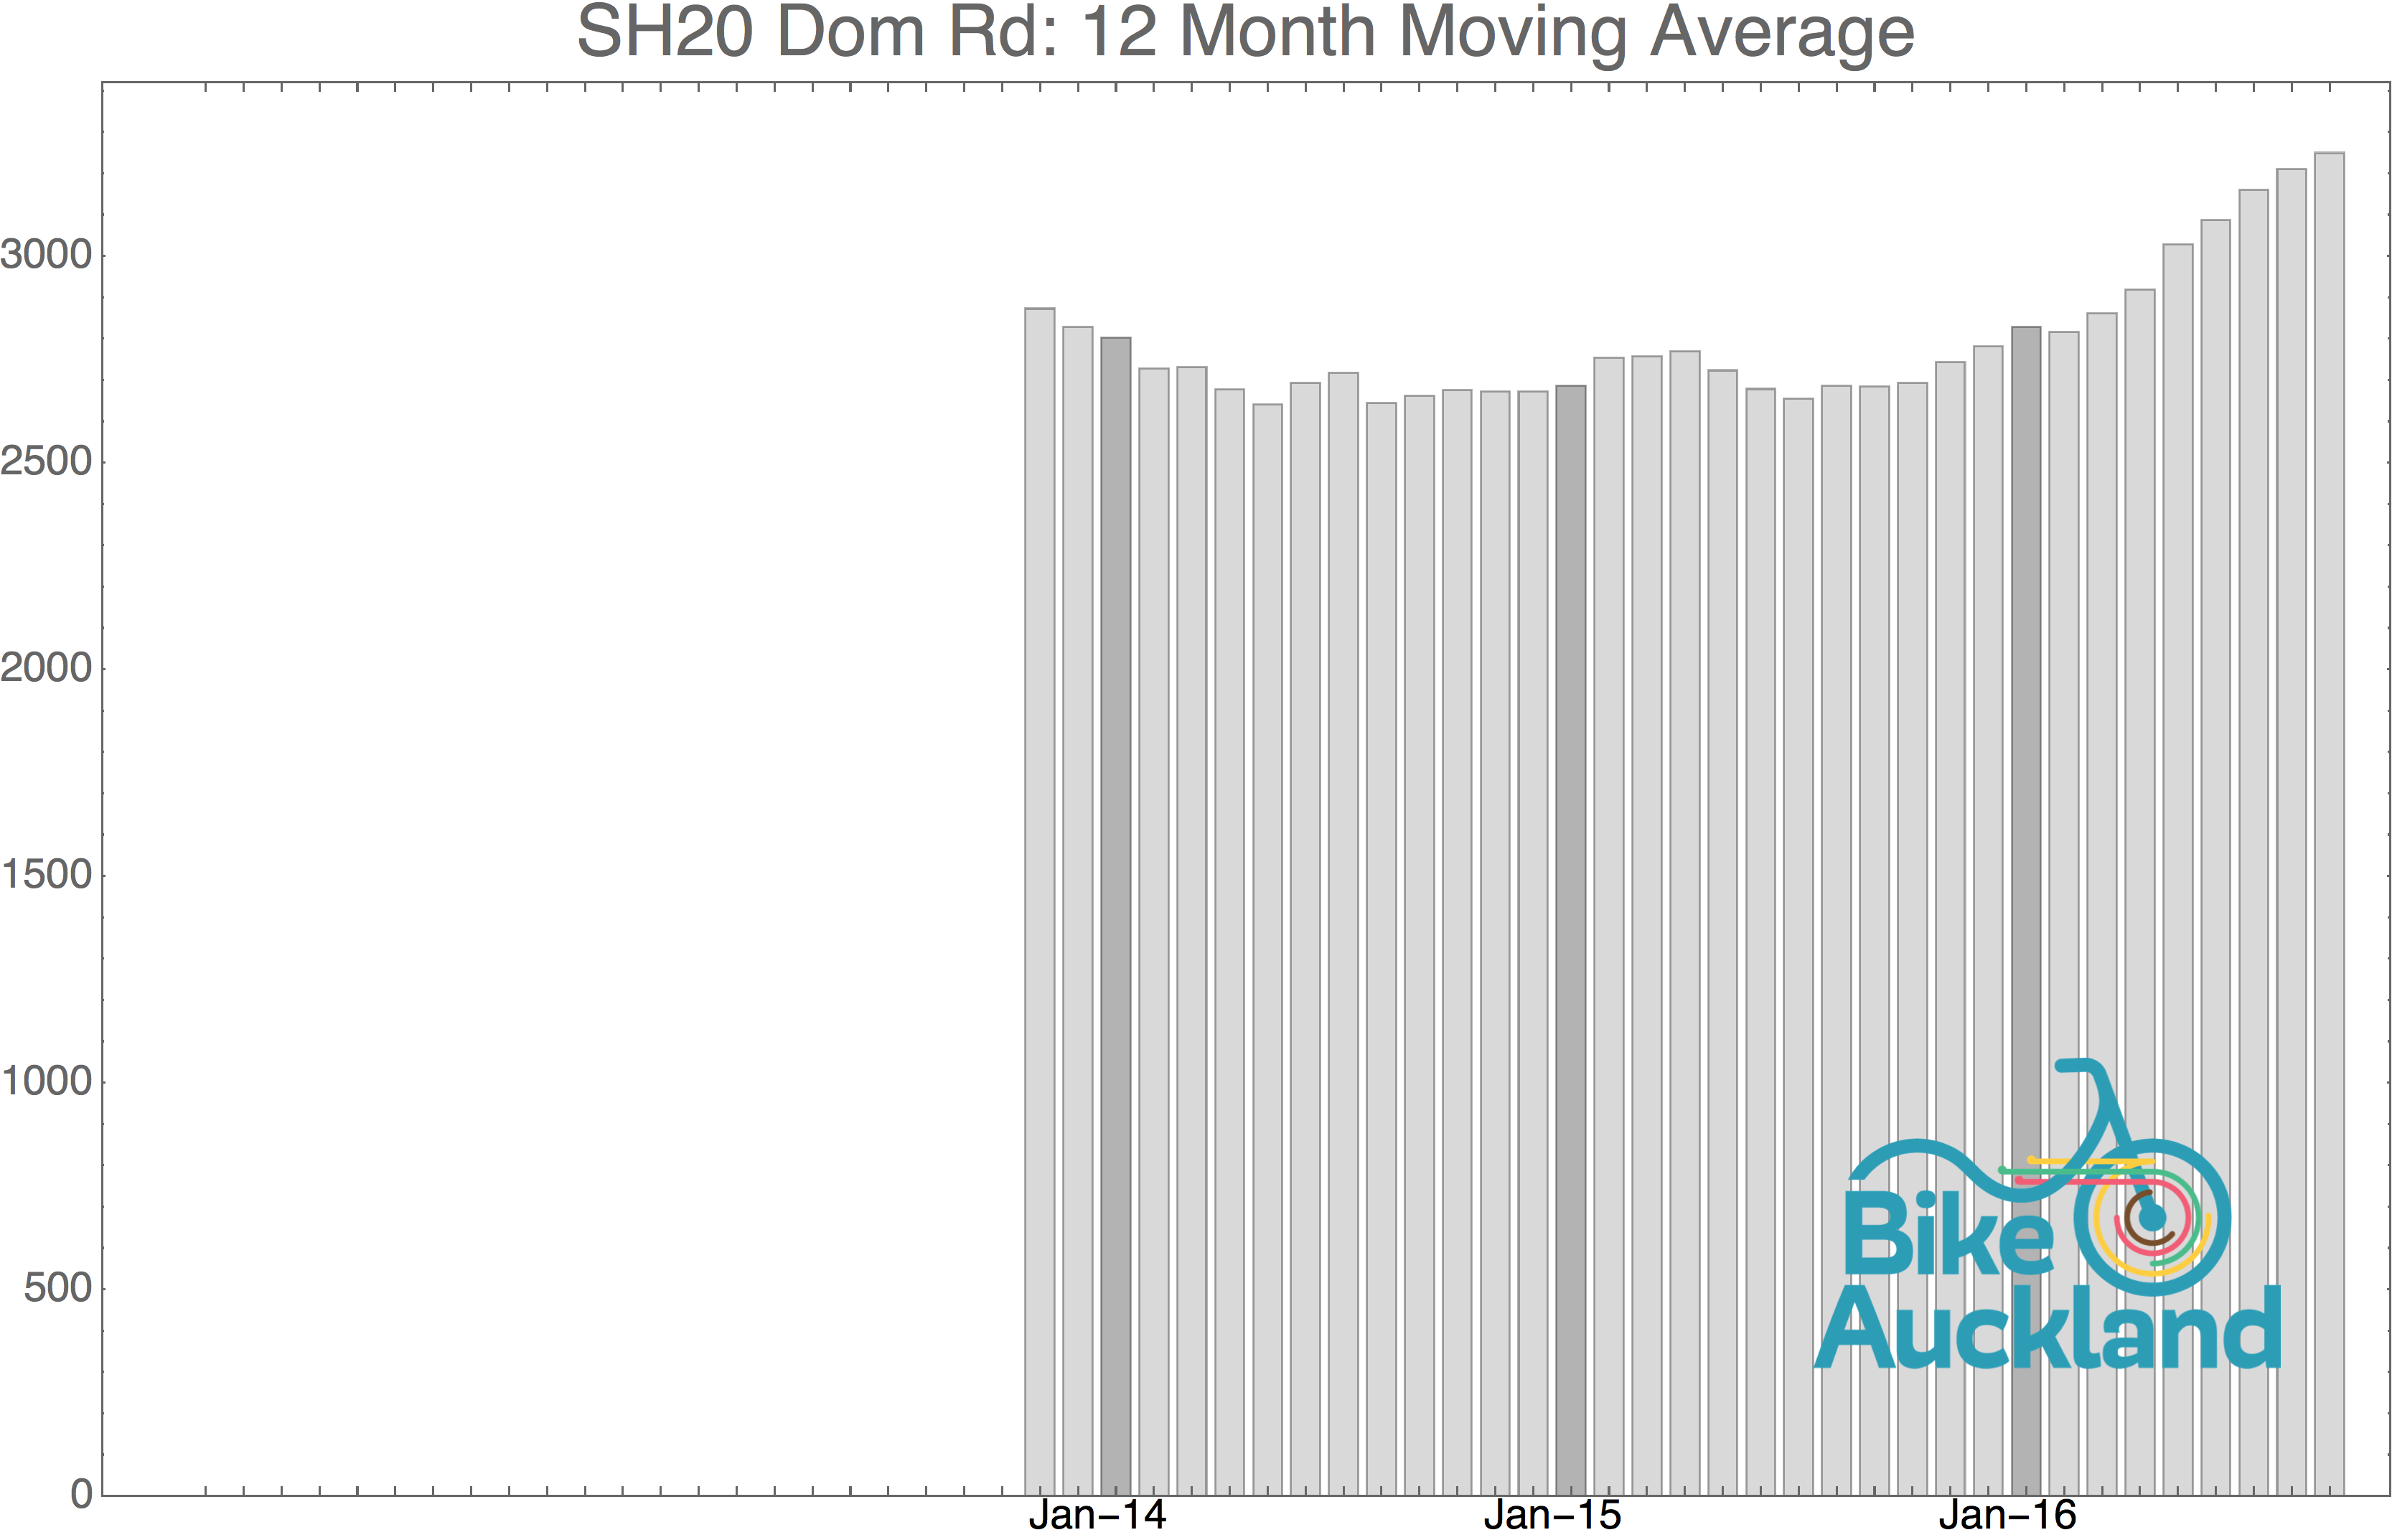
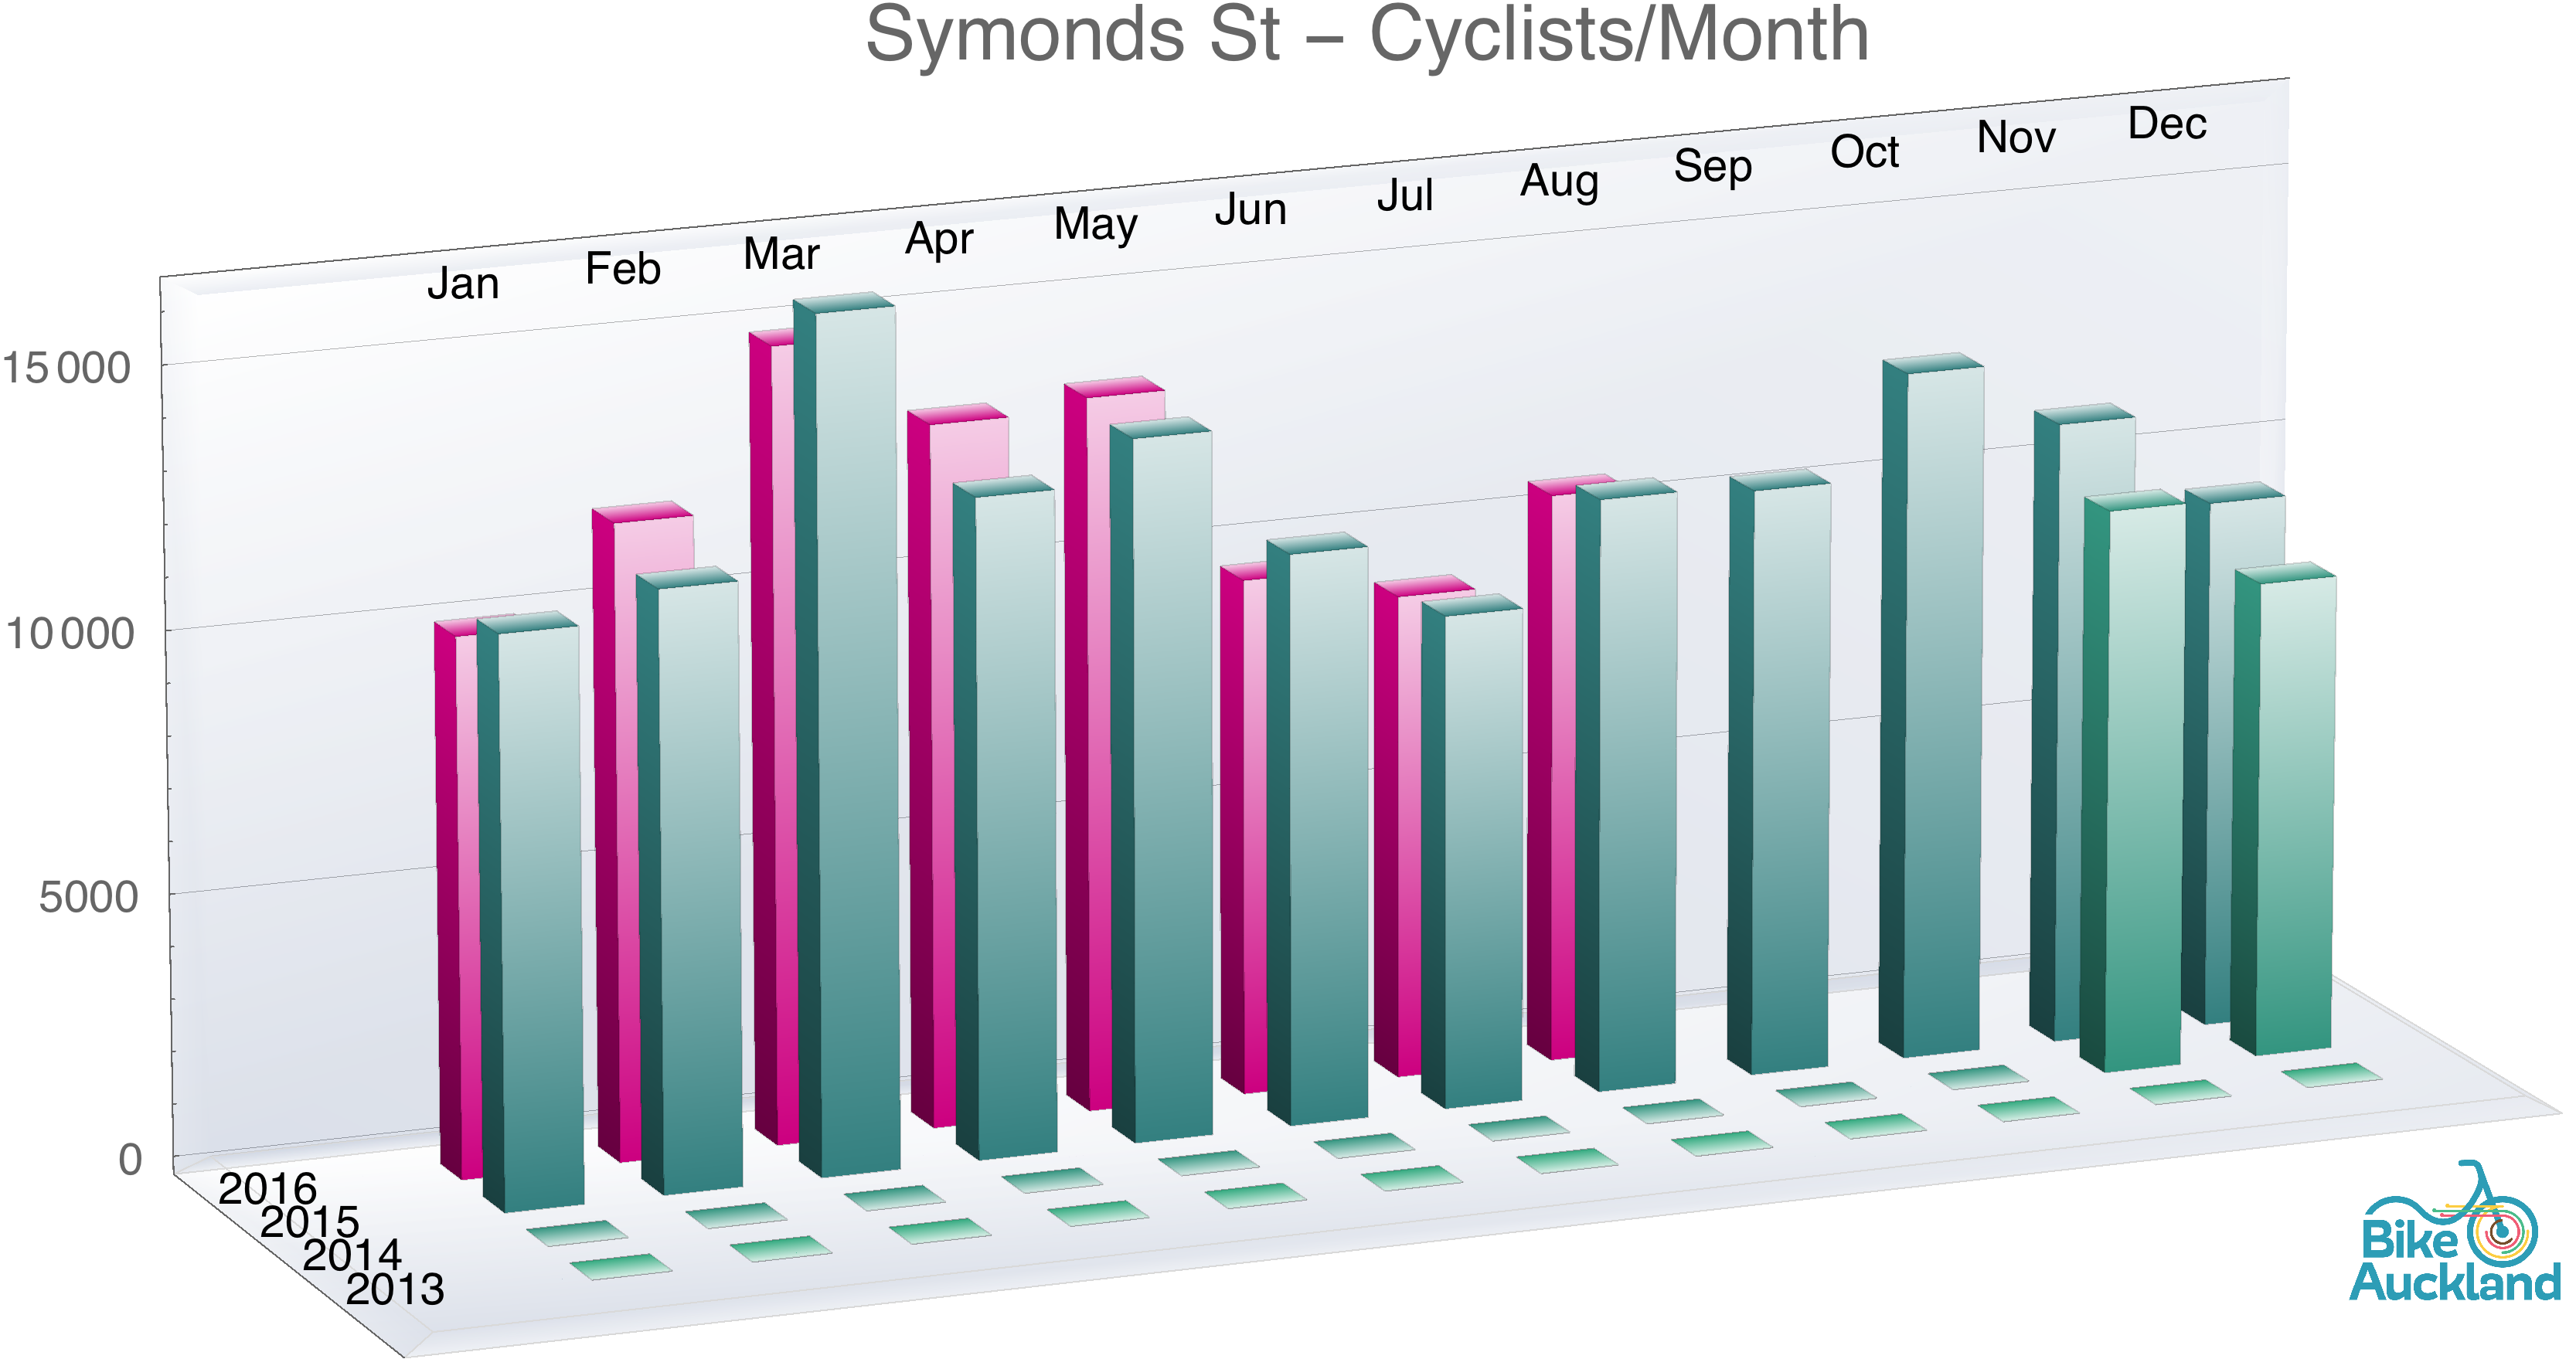
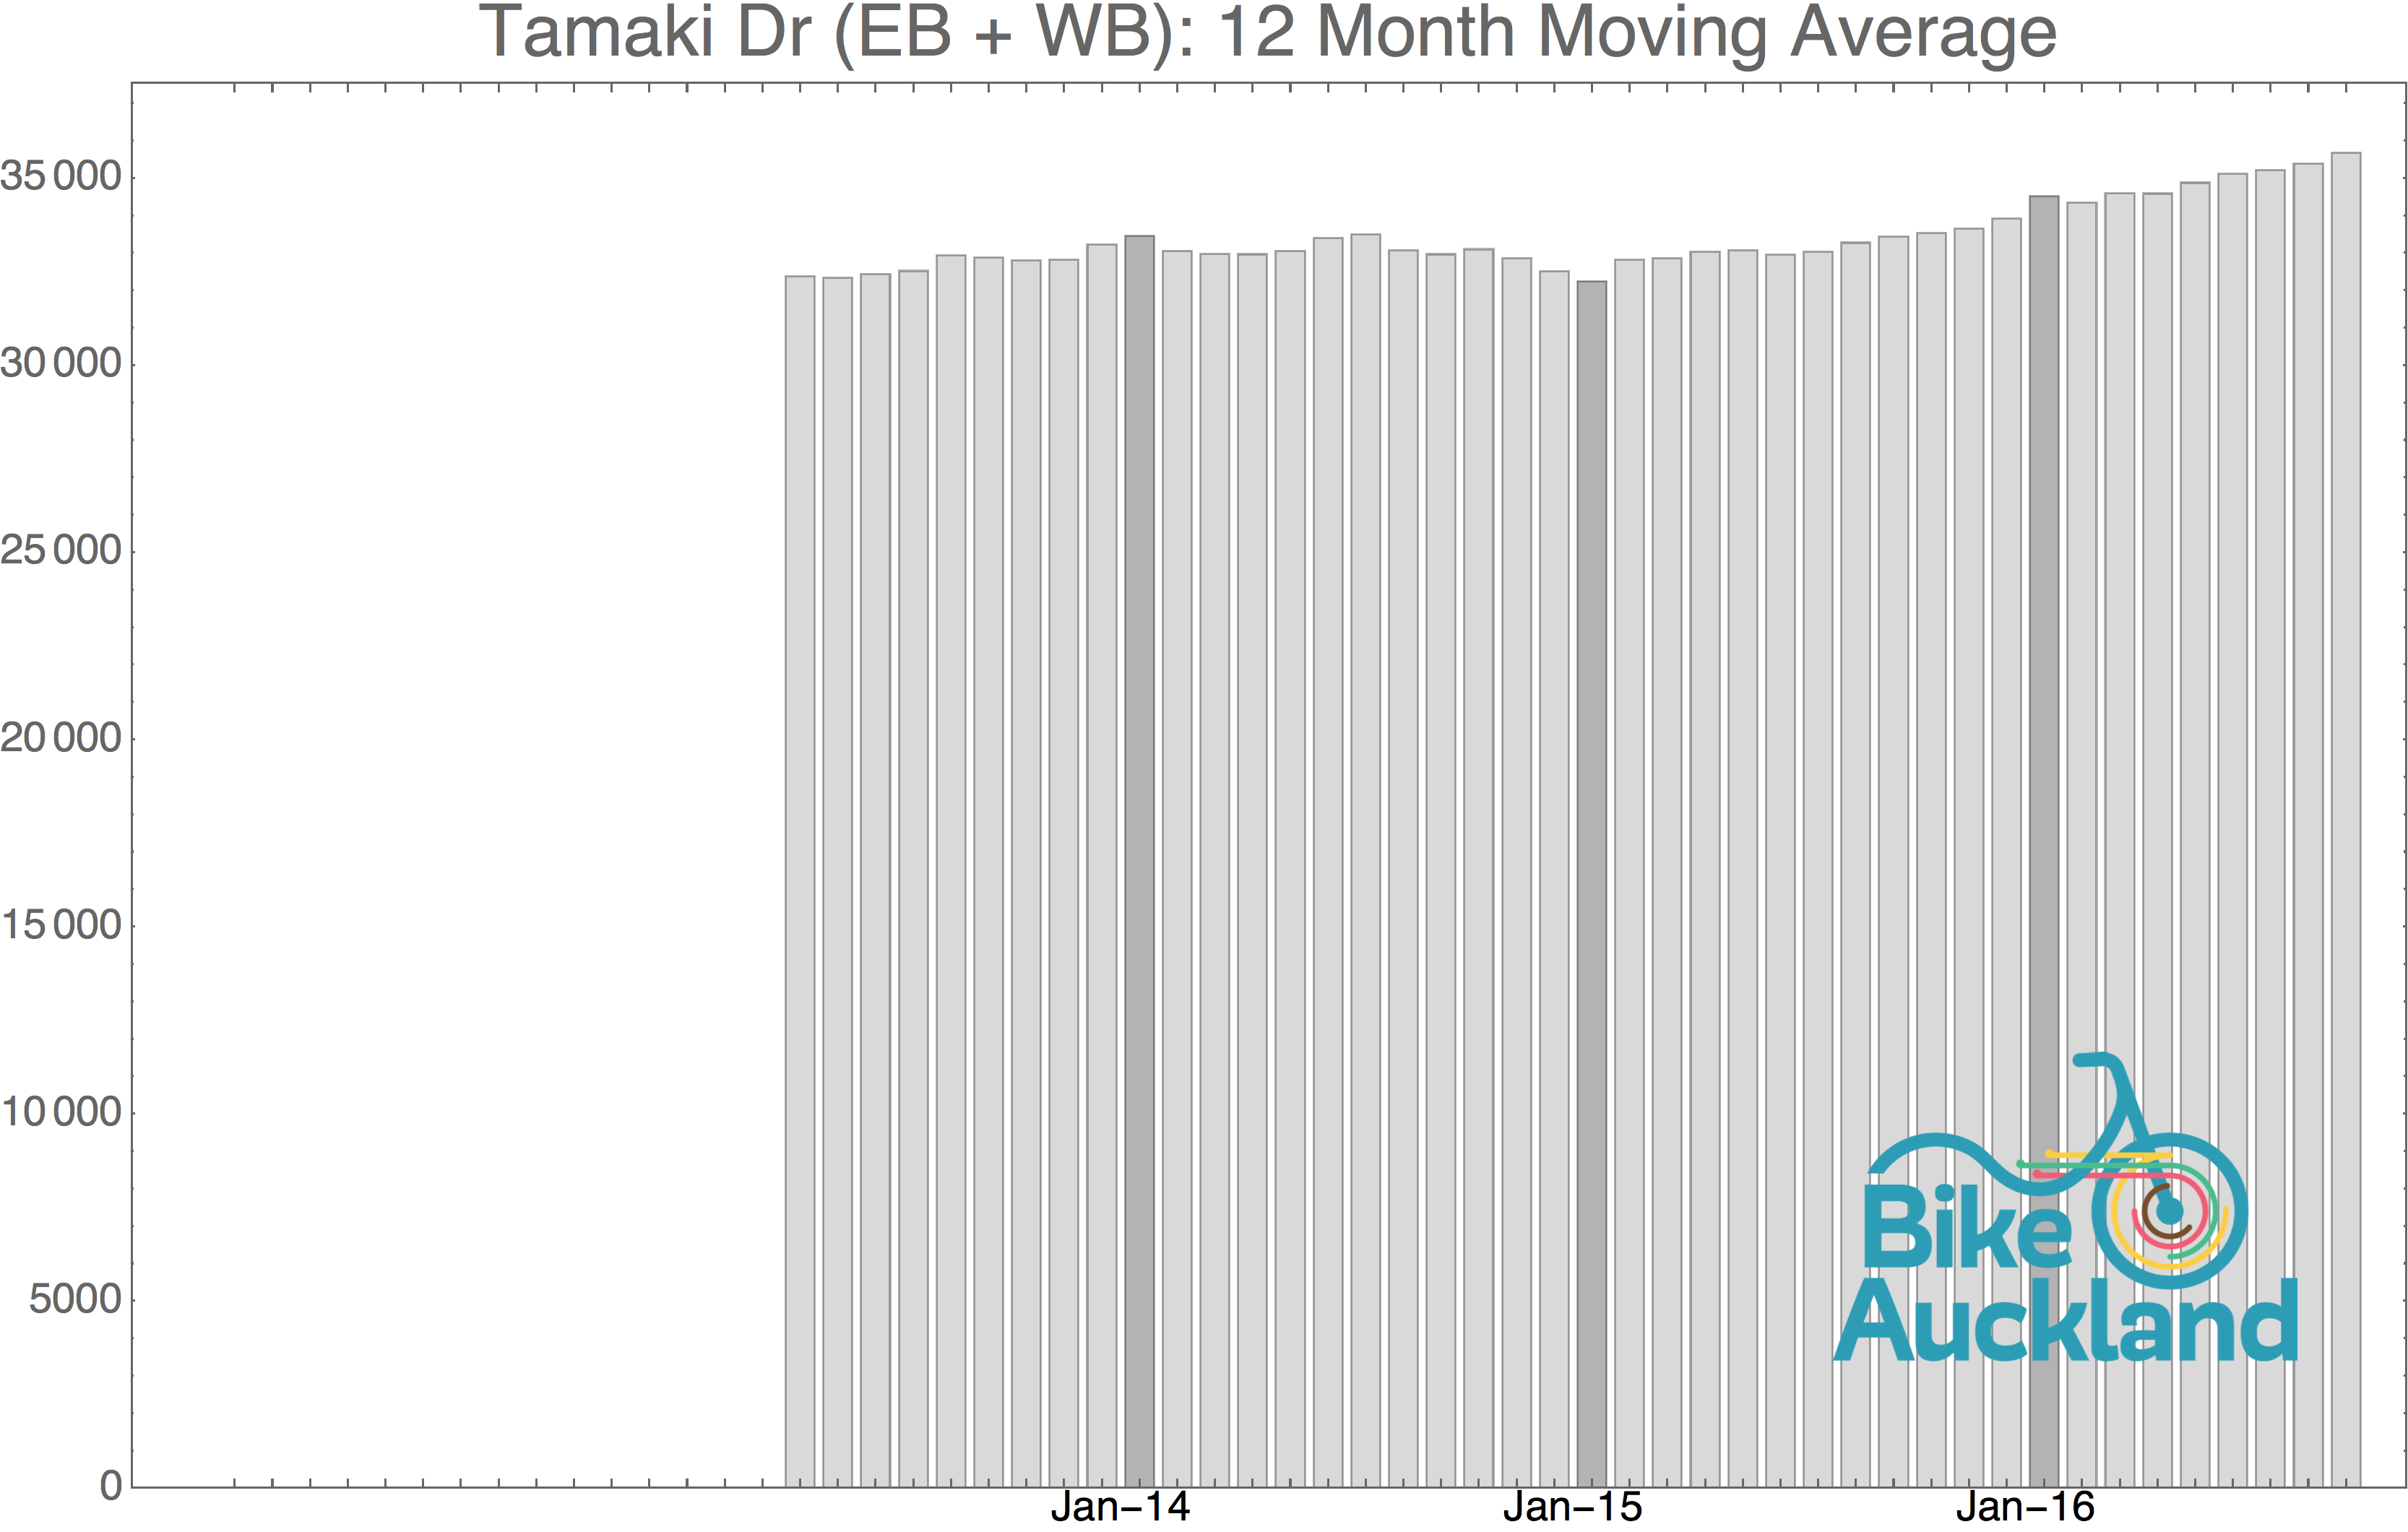
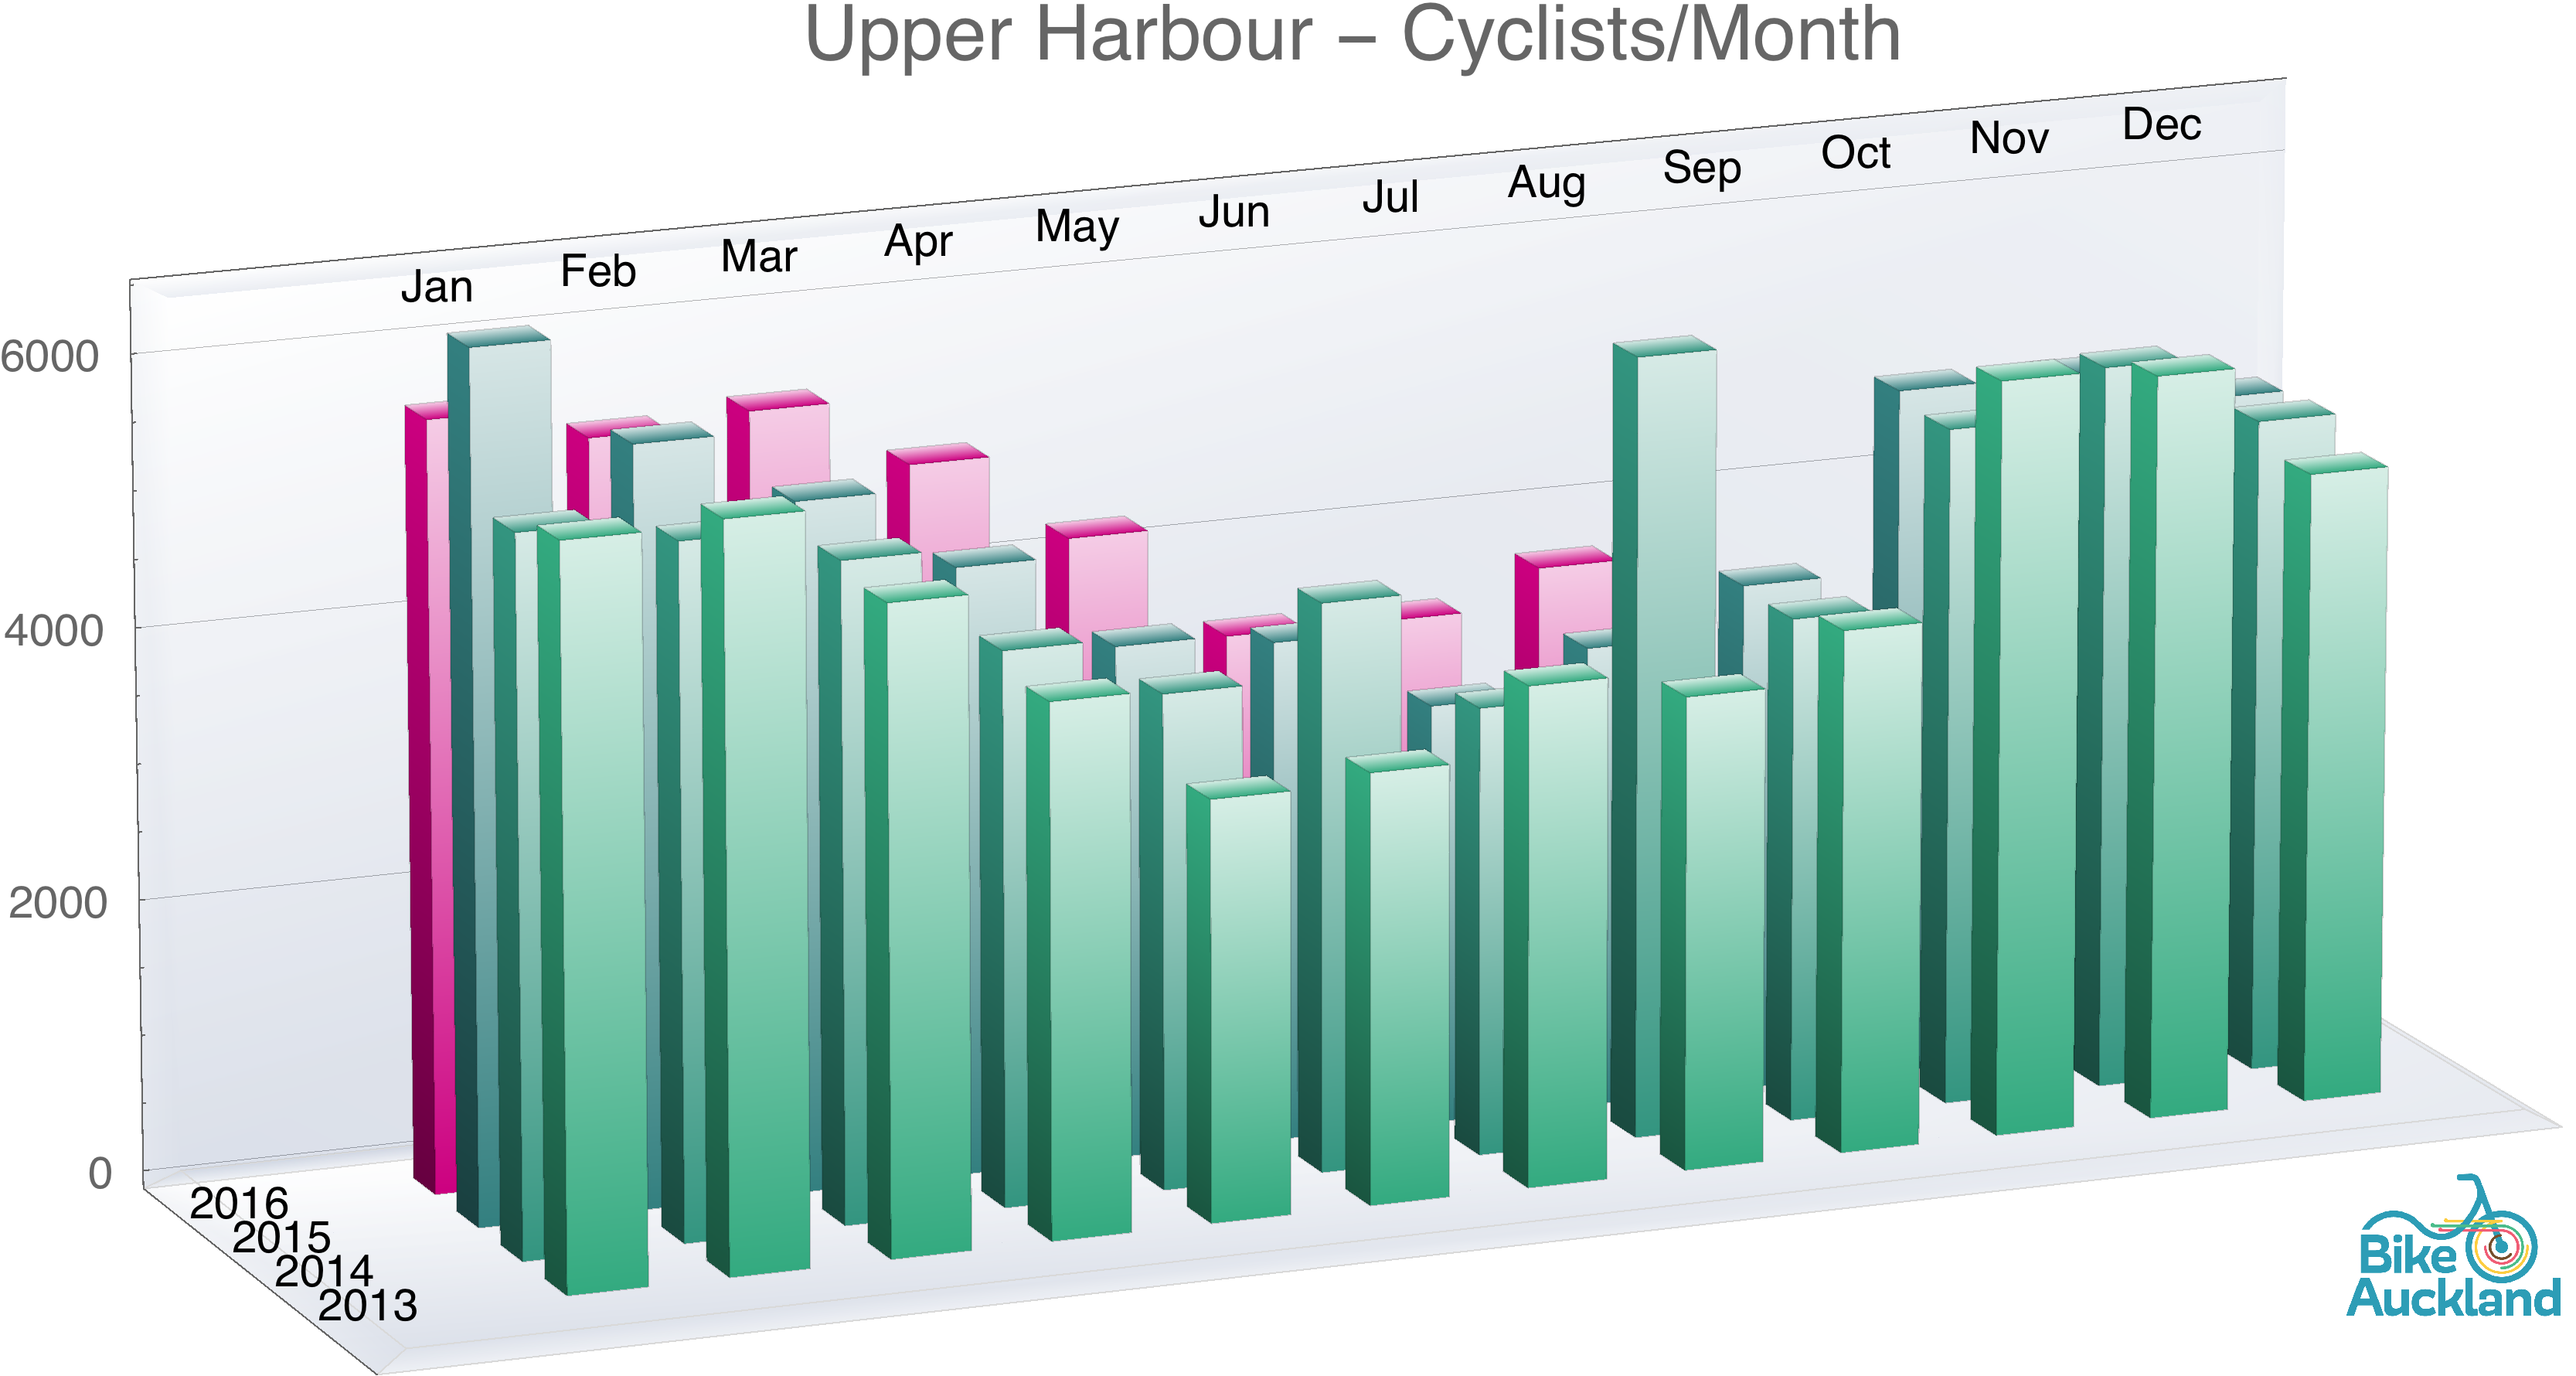
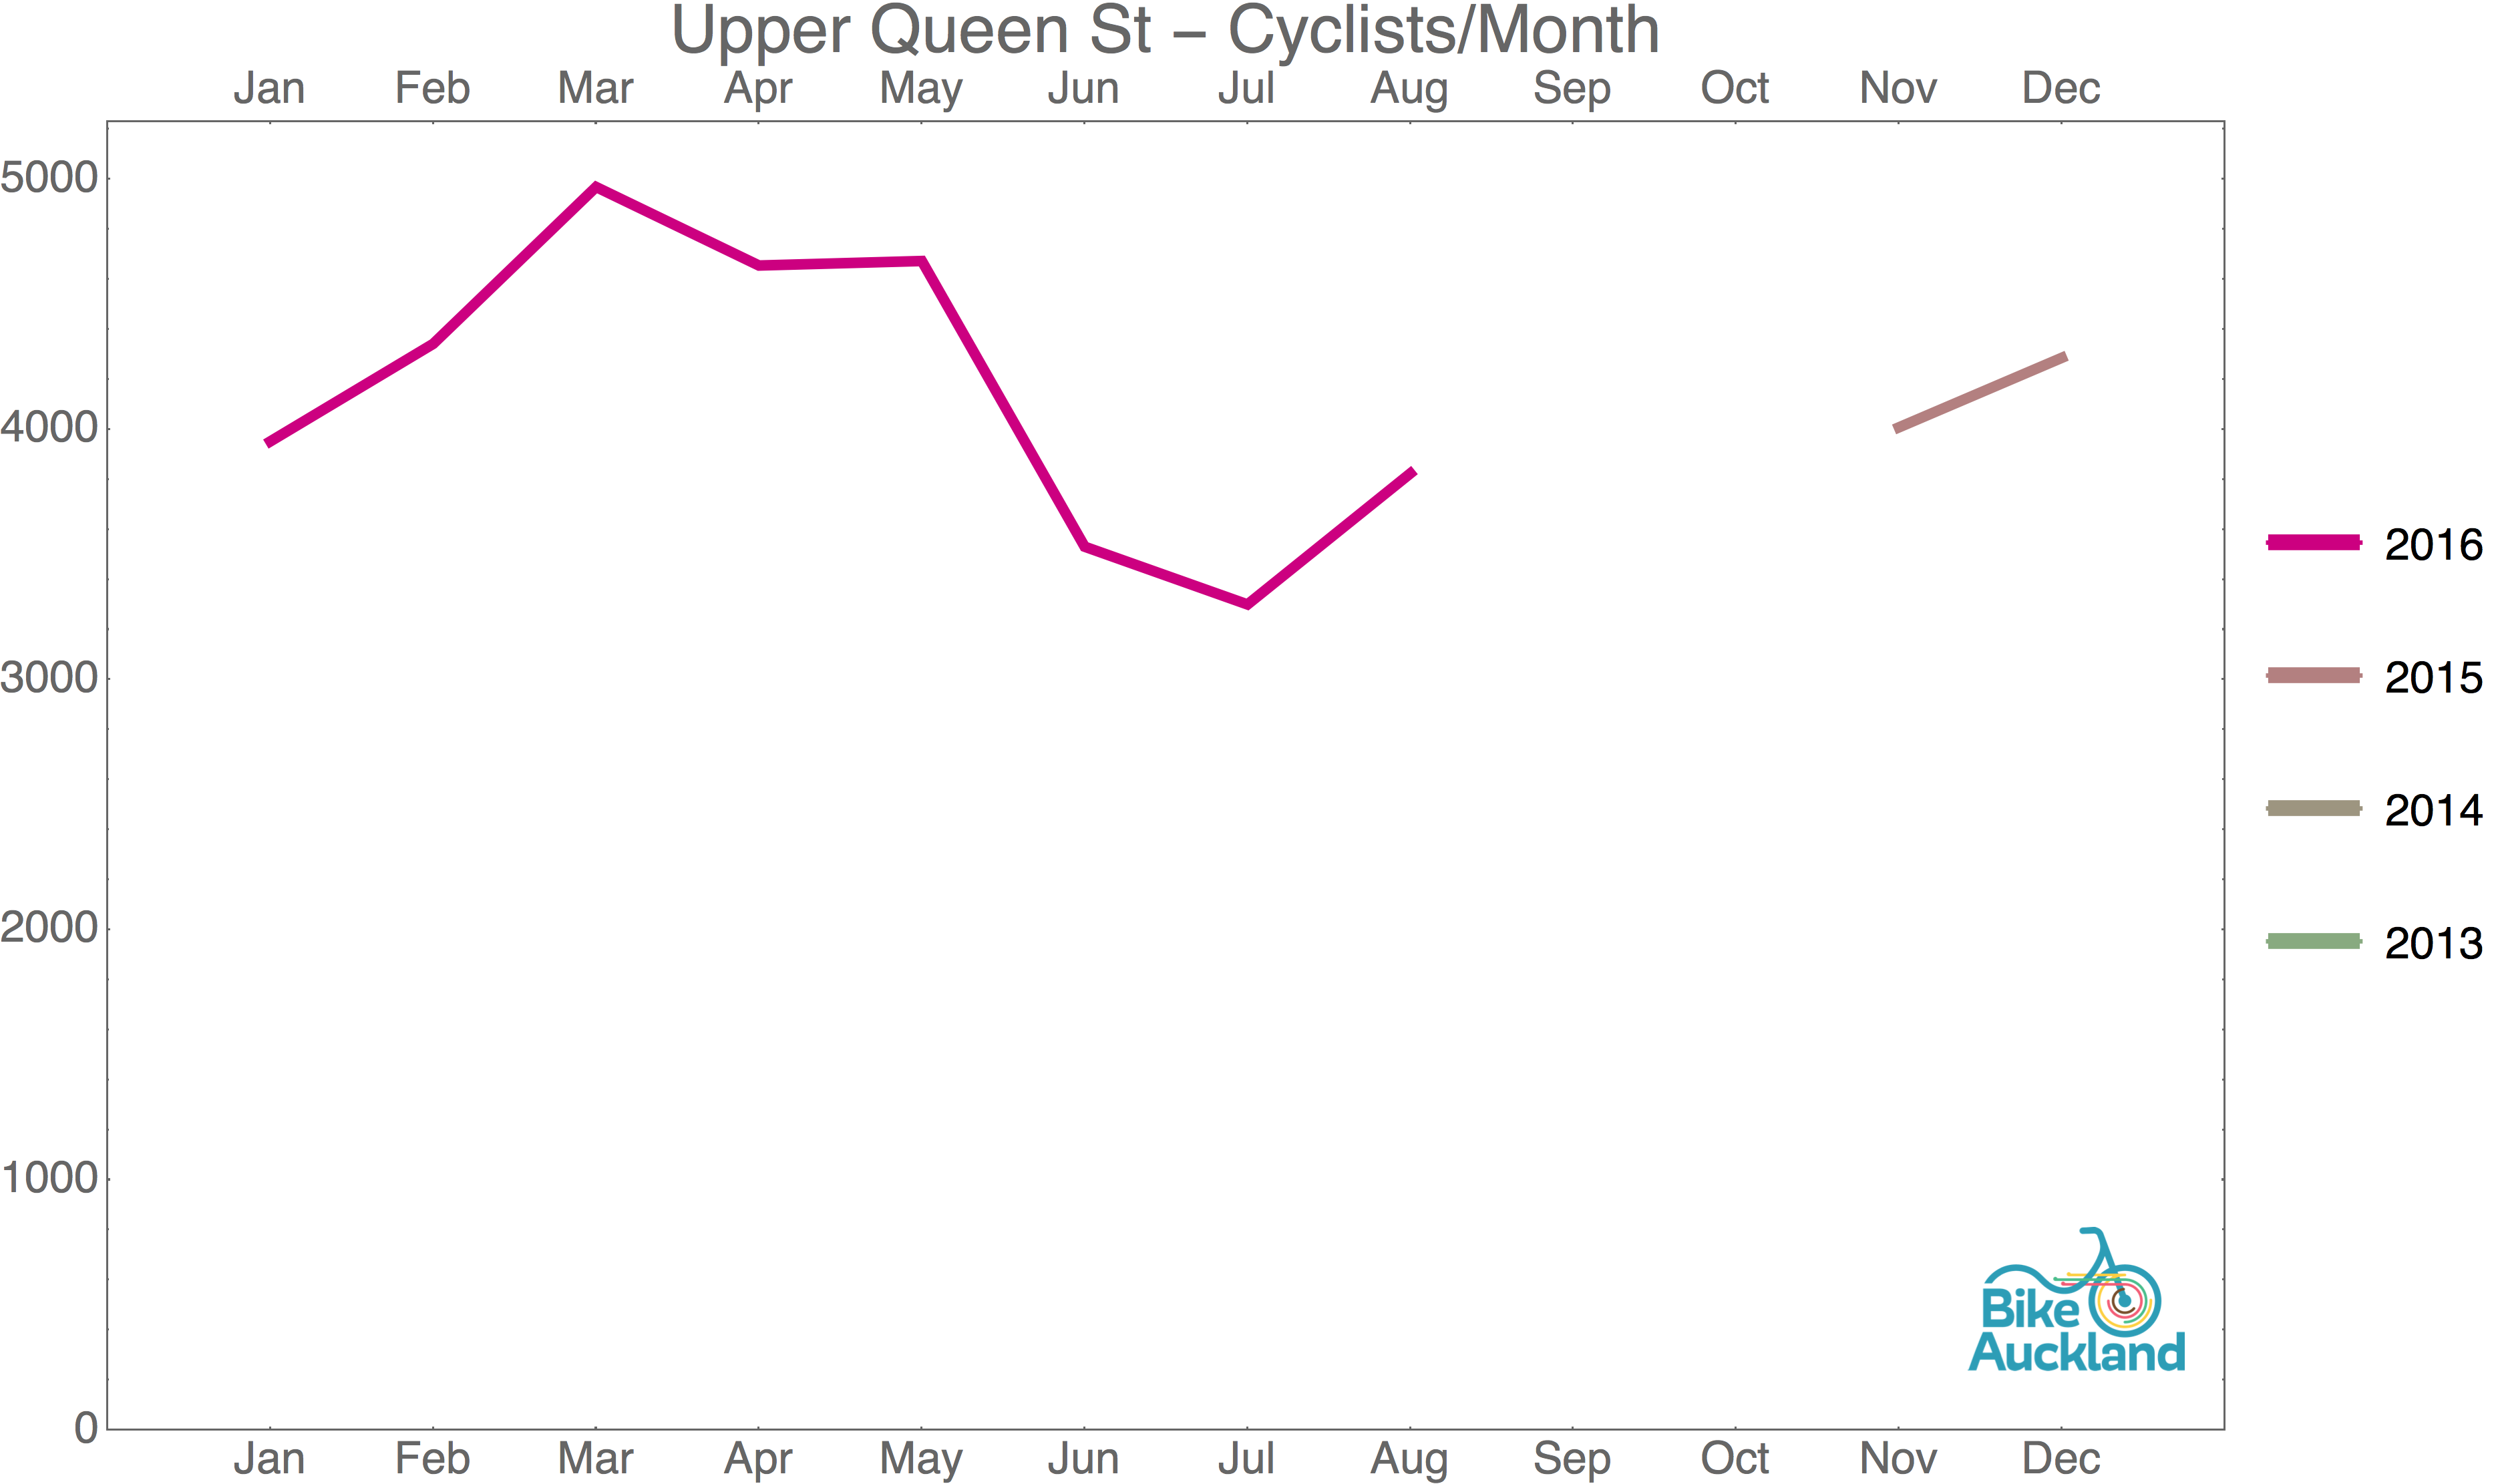
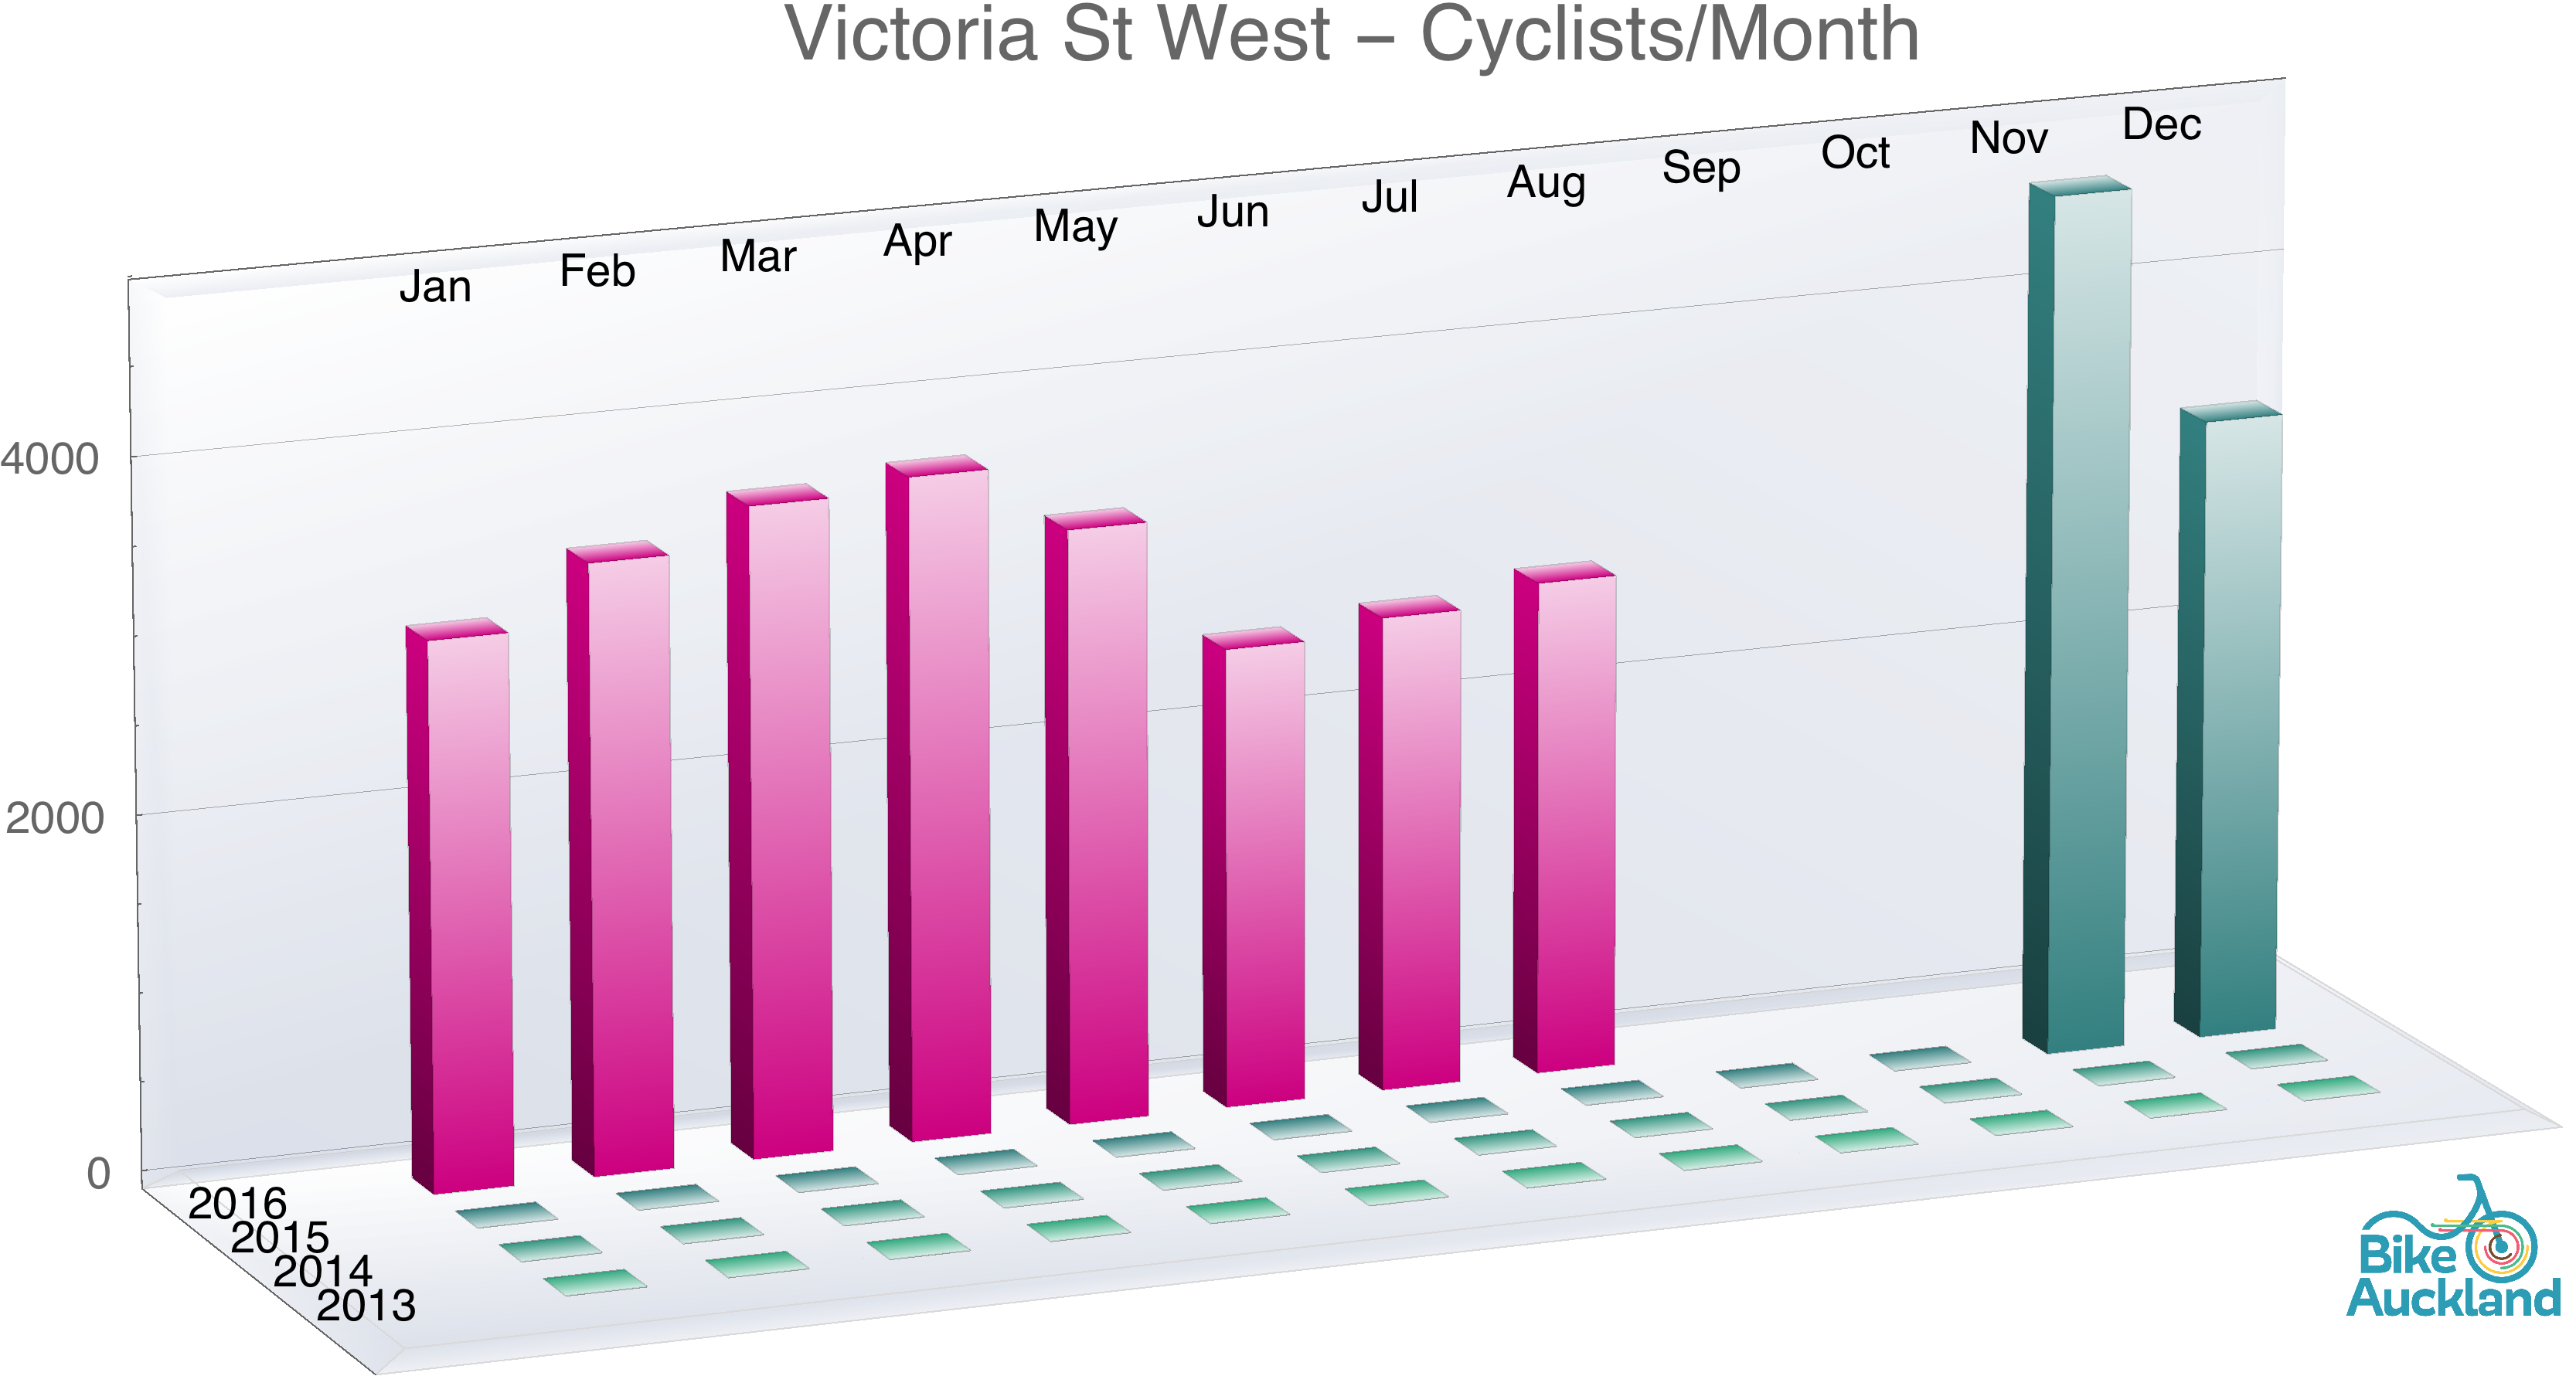
So, things are looking okay on the citywide rolling stats. Keen to look more closely? Well, brace yourself, because our stalwart associate Richard has produced the newest super-detailed stat graphs for all the individual counter locations, displayed in glorious colour and multiple designs. And for some counters where multiple years of data are available, Richard has even produced 12-month-rolling averages, which is the best way to see long-term trends, with any short-term spikes smoothed out.
Our current volunteer workload (and the sheer number of counters) prevents us from giving you blow-by-blow comments on every location – but some interesting things to look at would be:
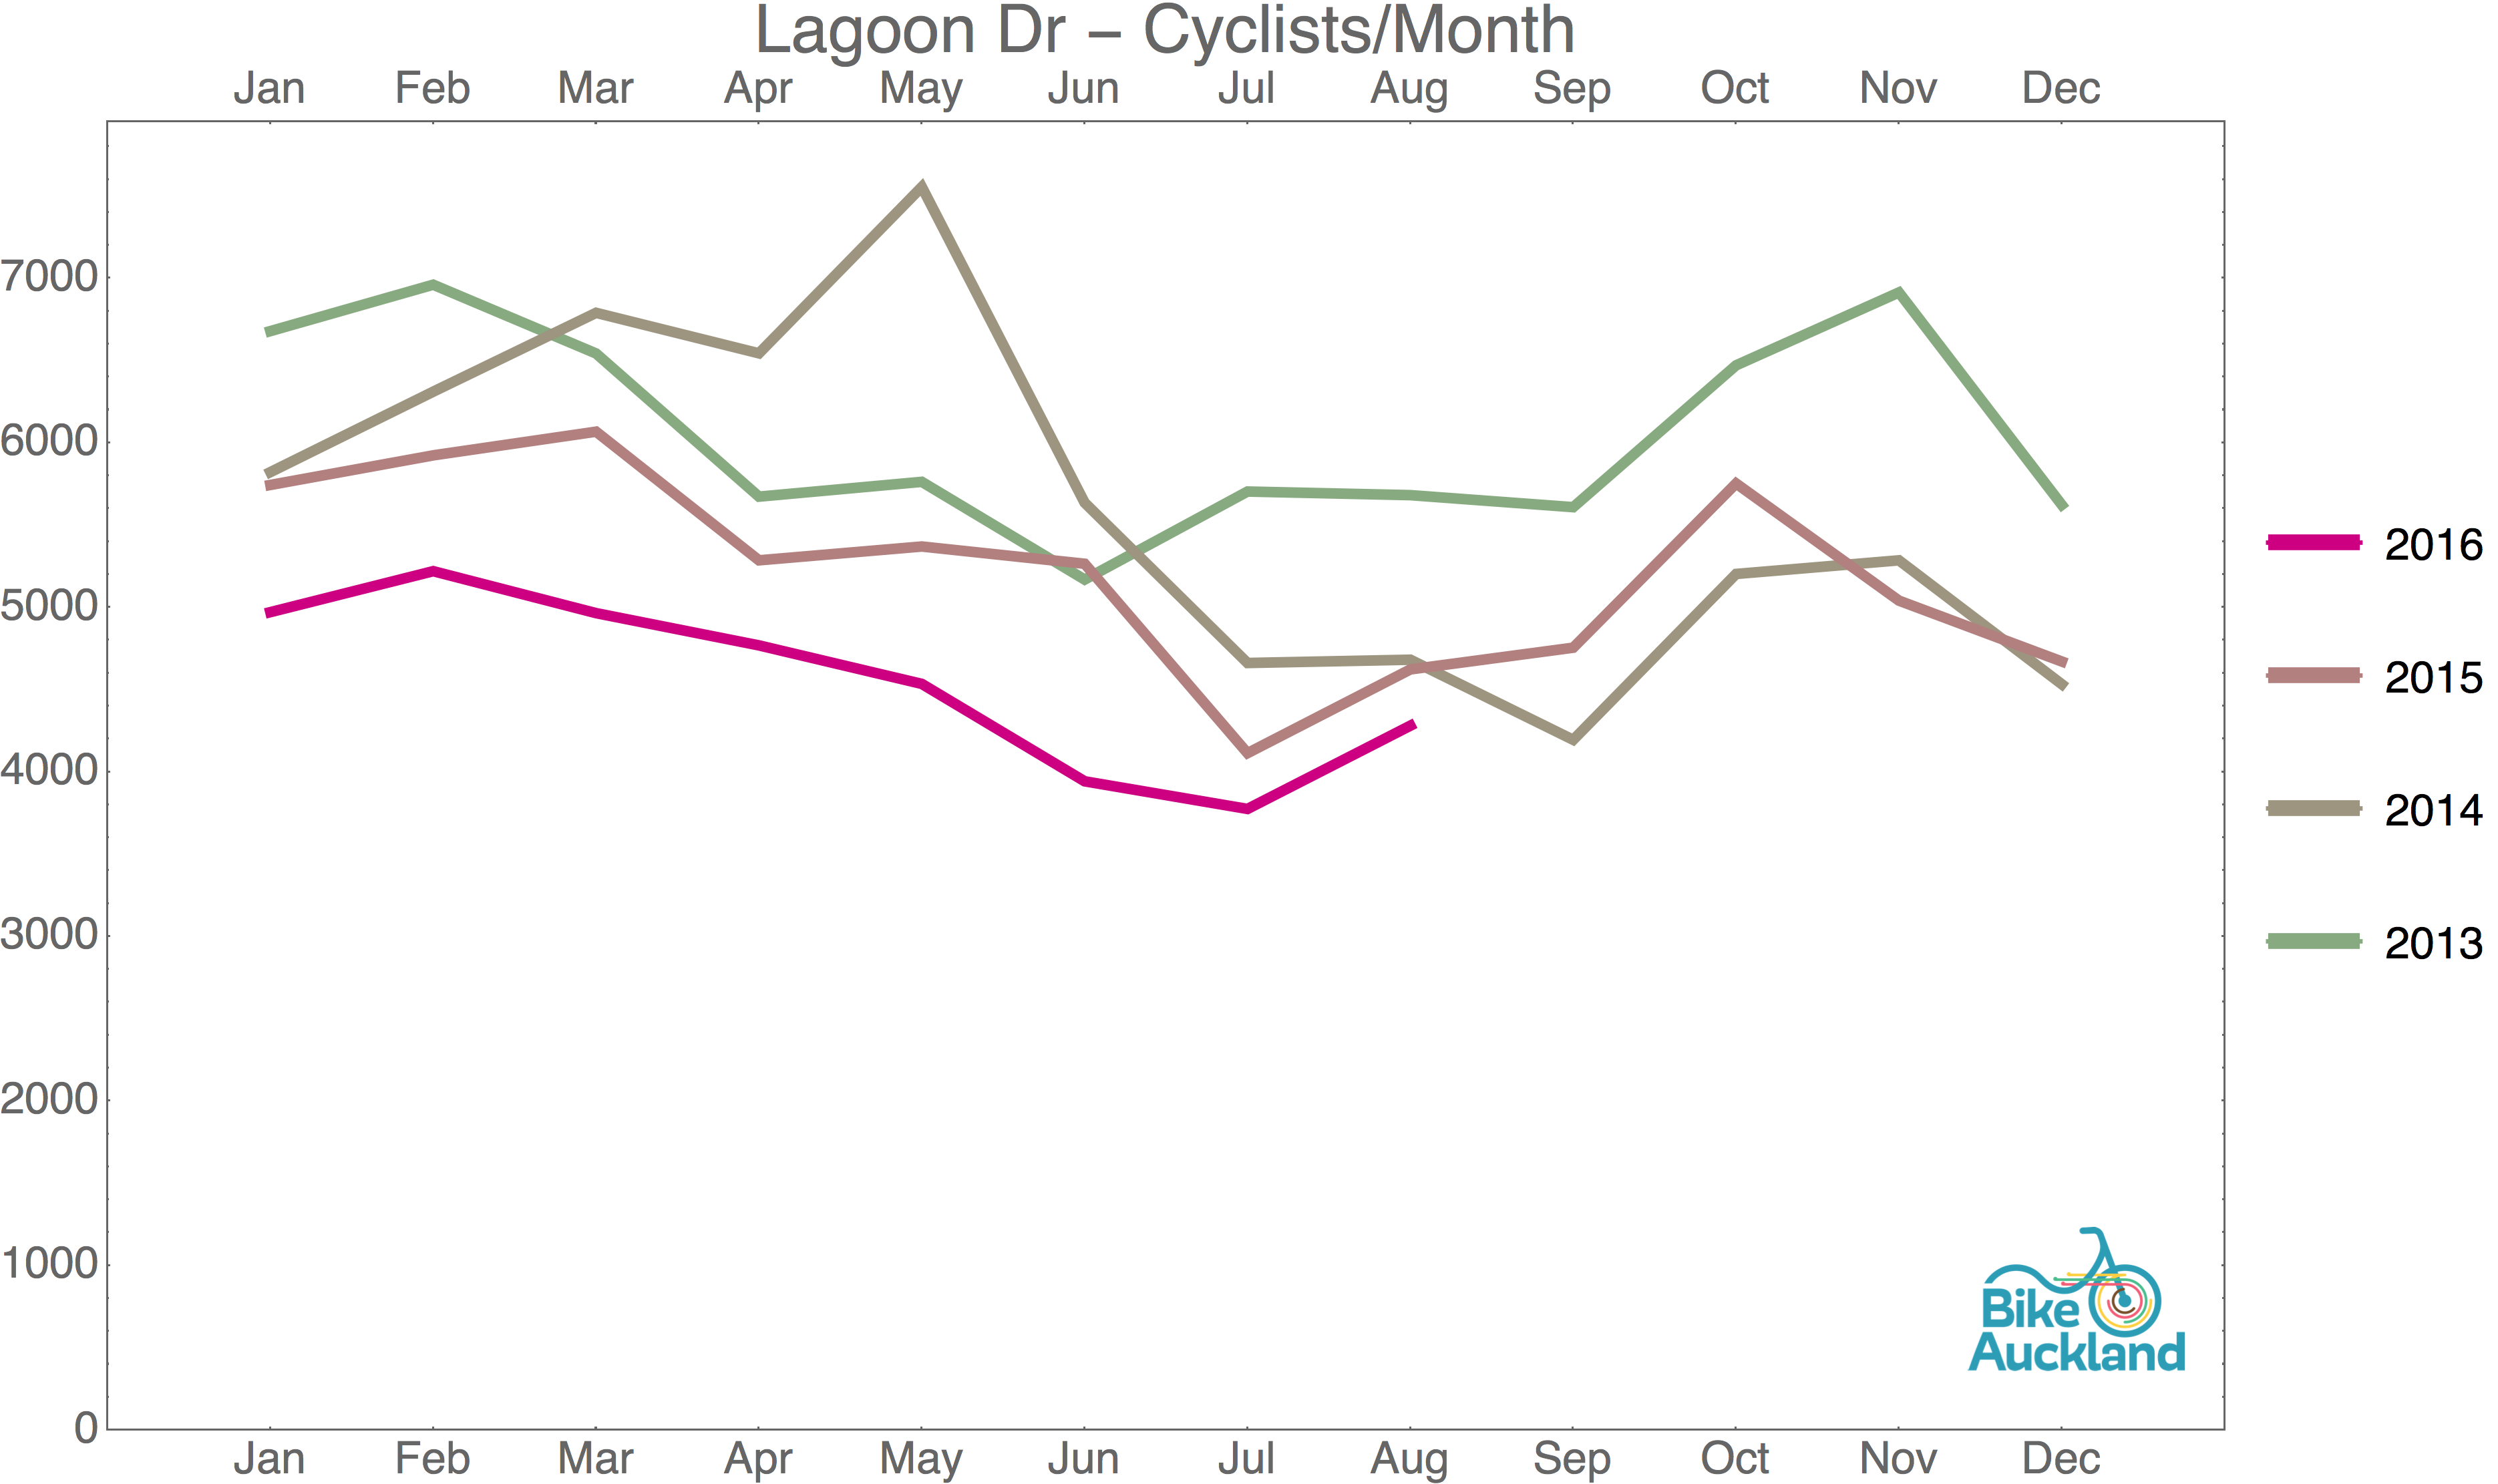
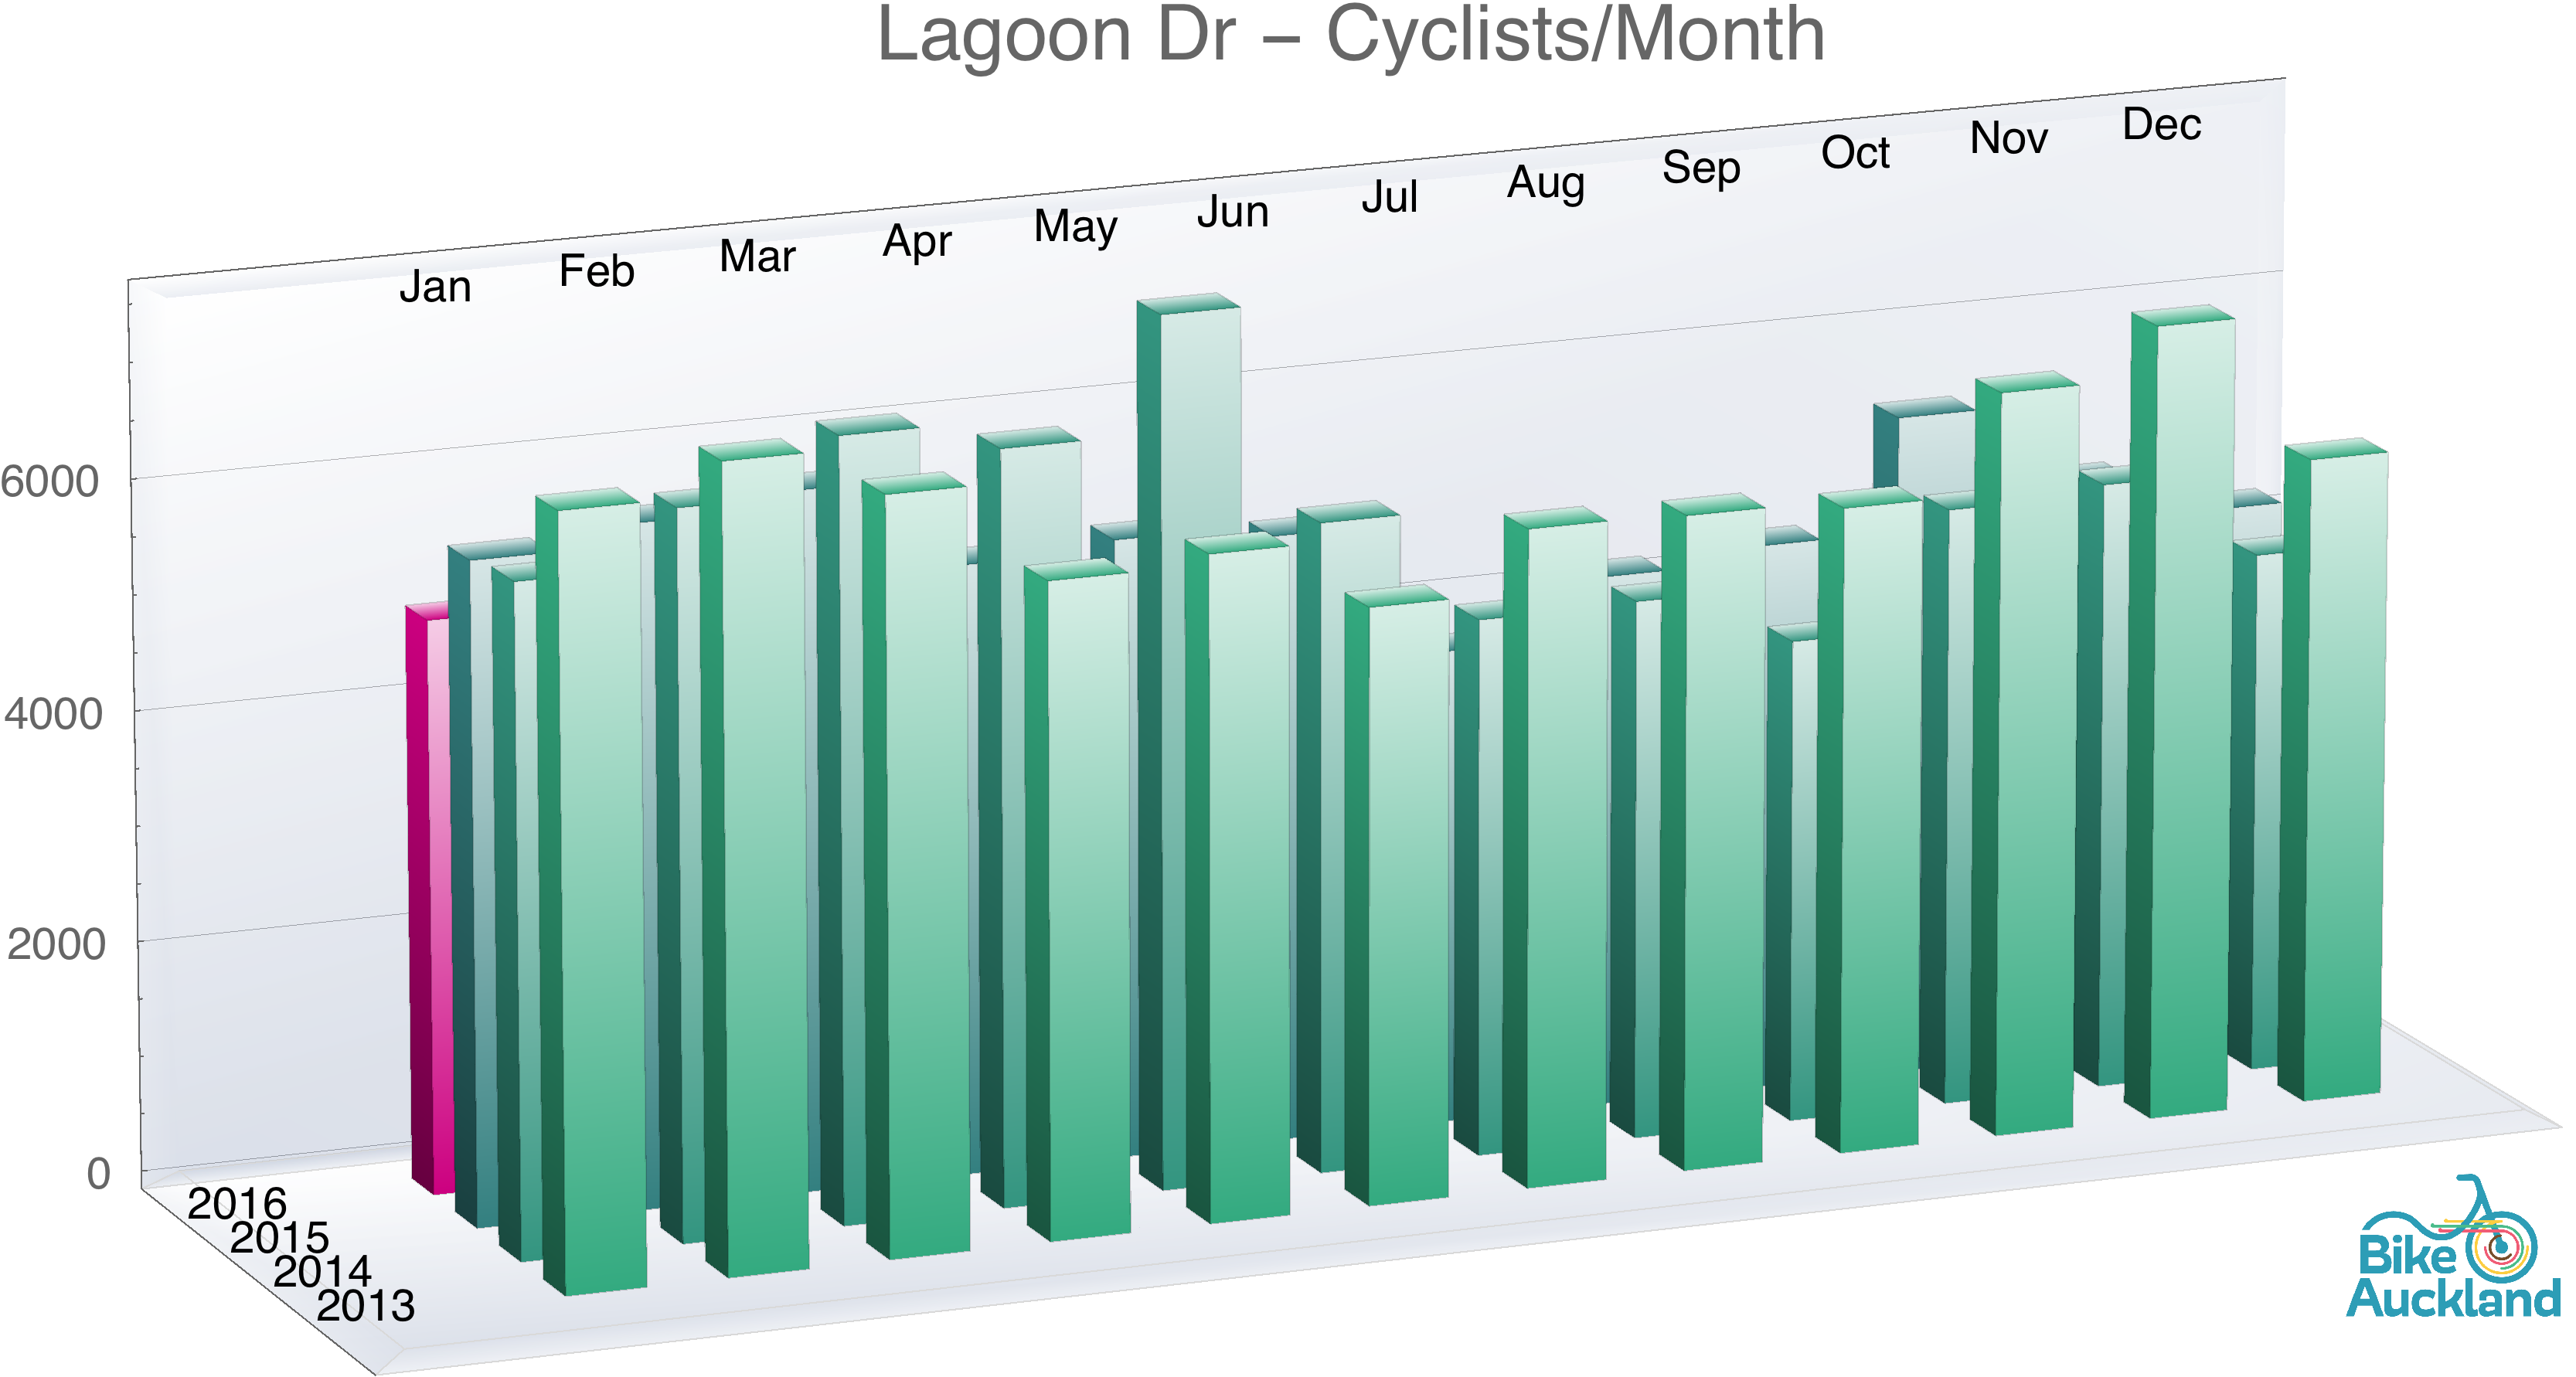
- The sad ones: Like Lagoon Drive – what’s happening there? Cycle numbers seem to continually be dropping?
- The static ones: Like East Coast Road, or Great South Road. Not much new infrastructure = not much change, and no network effect.
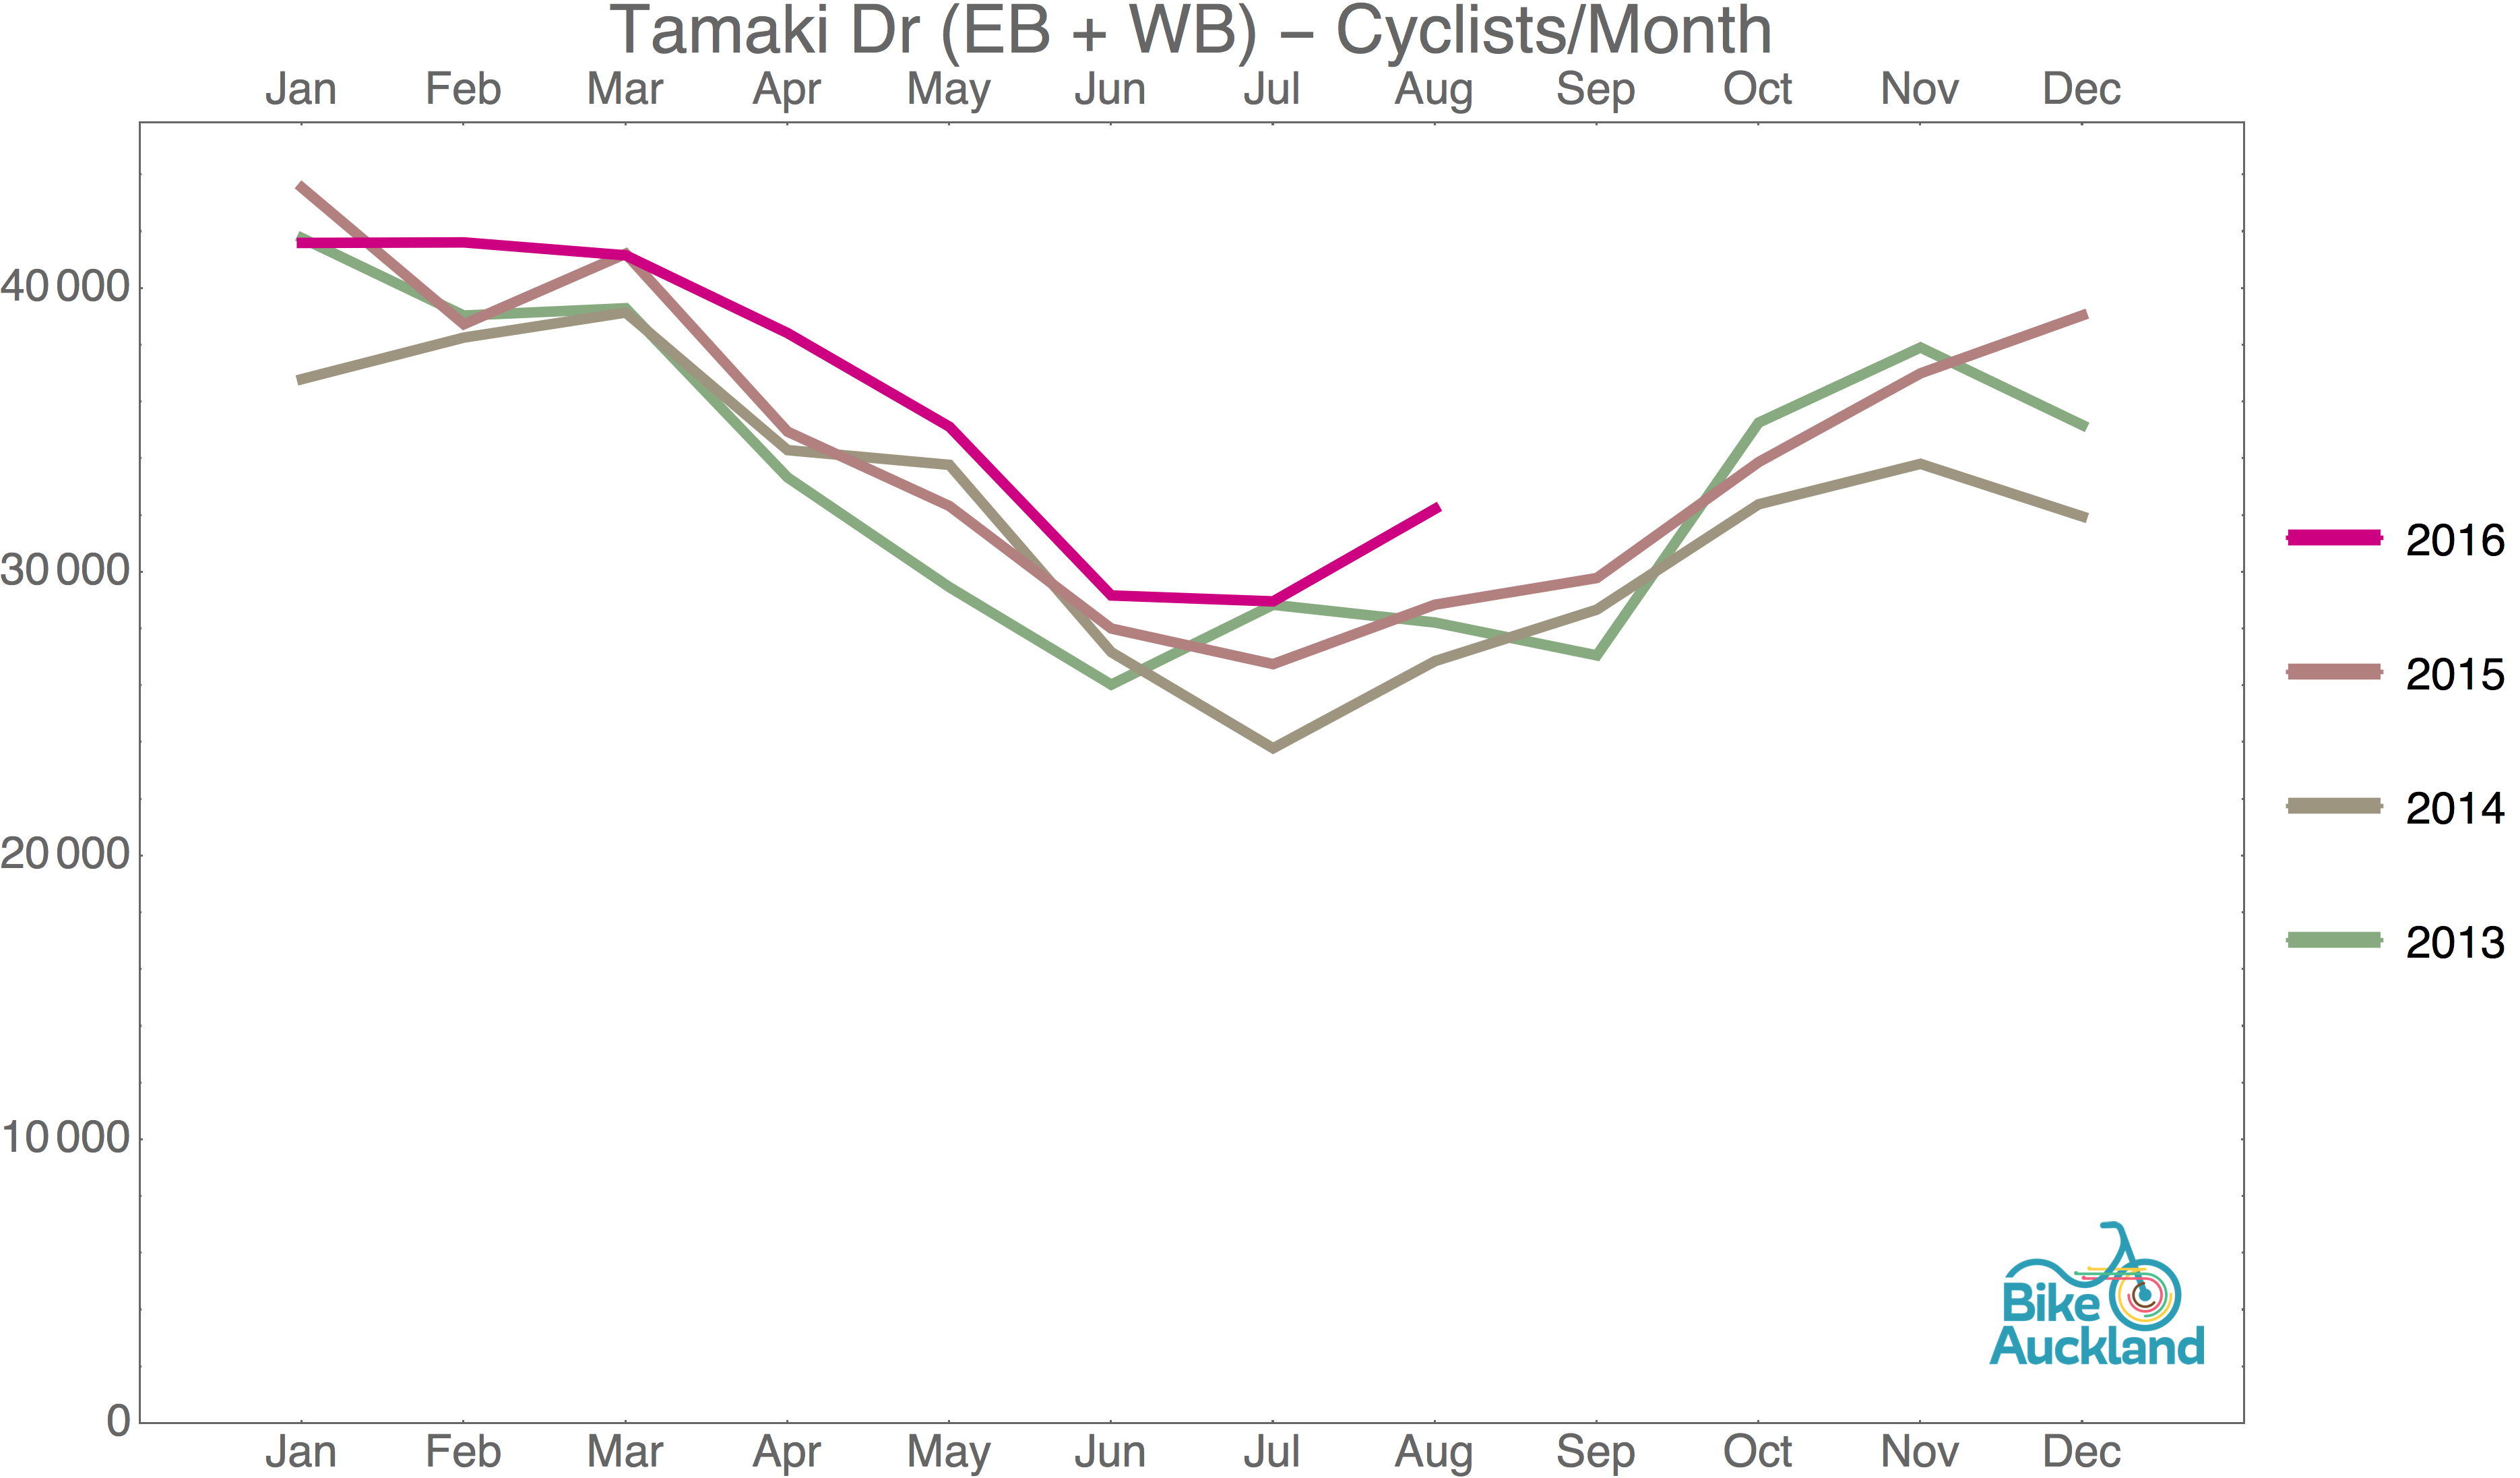
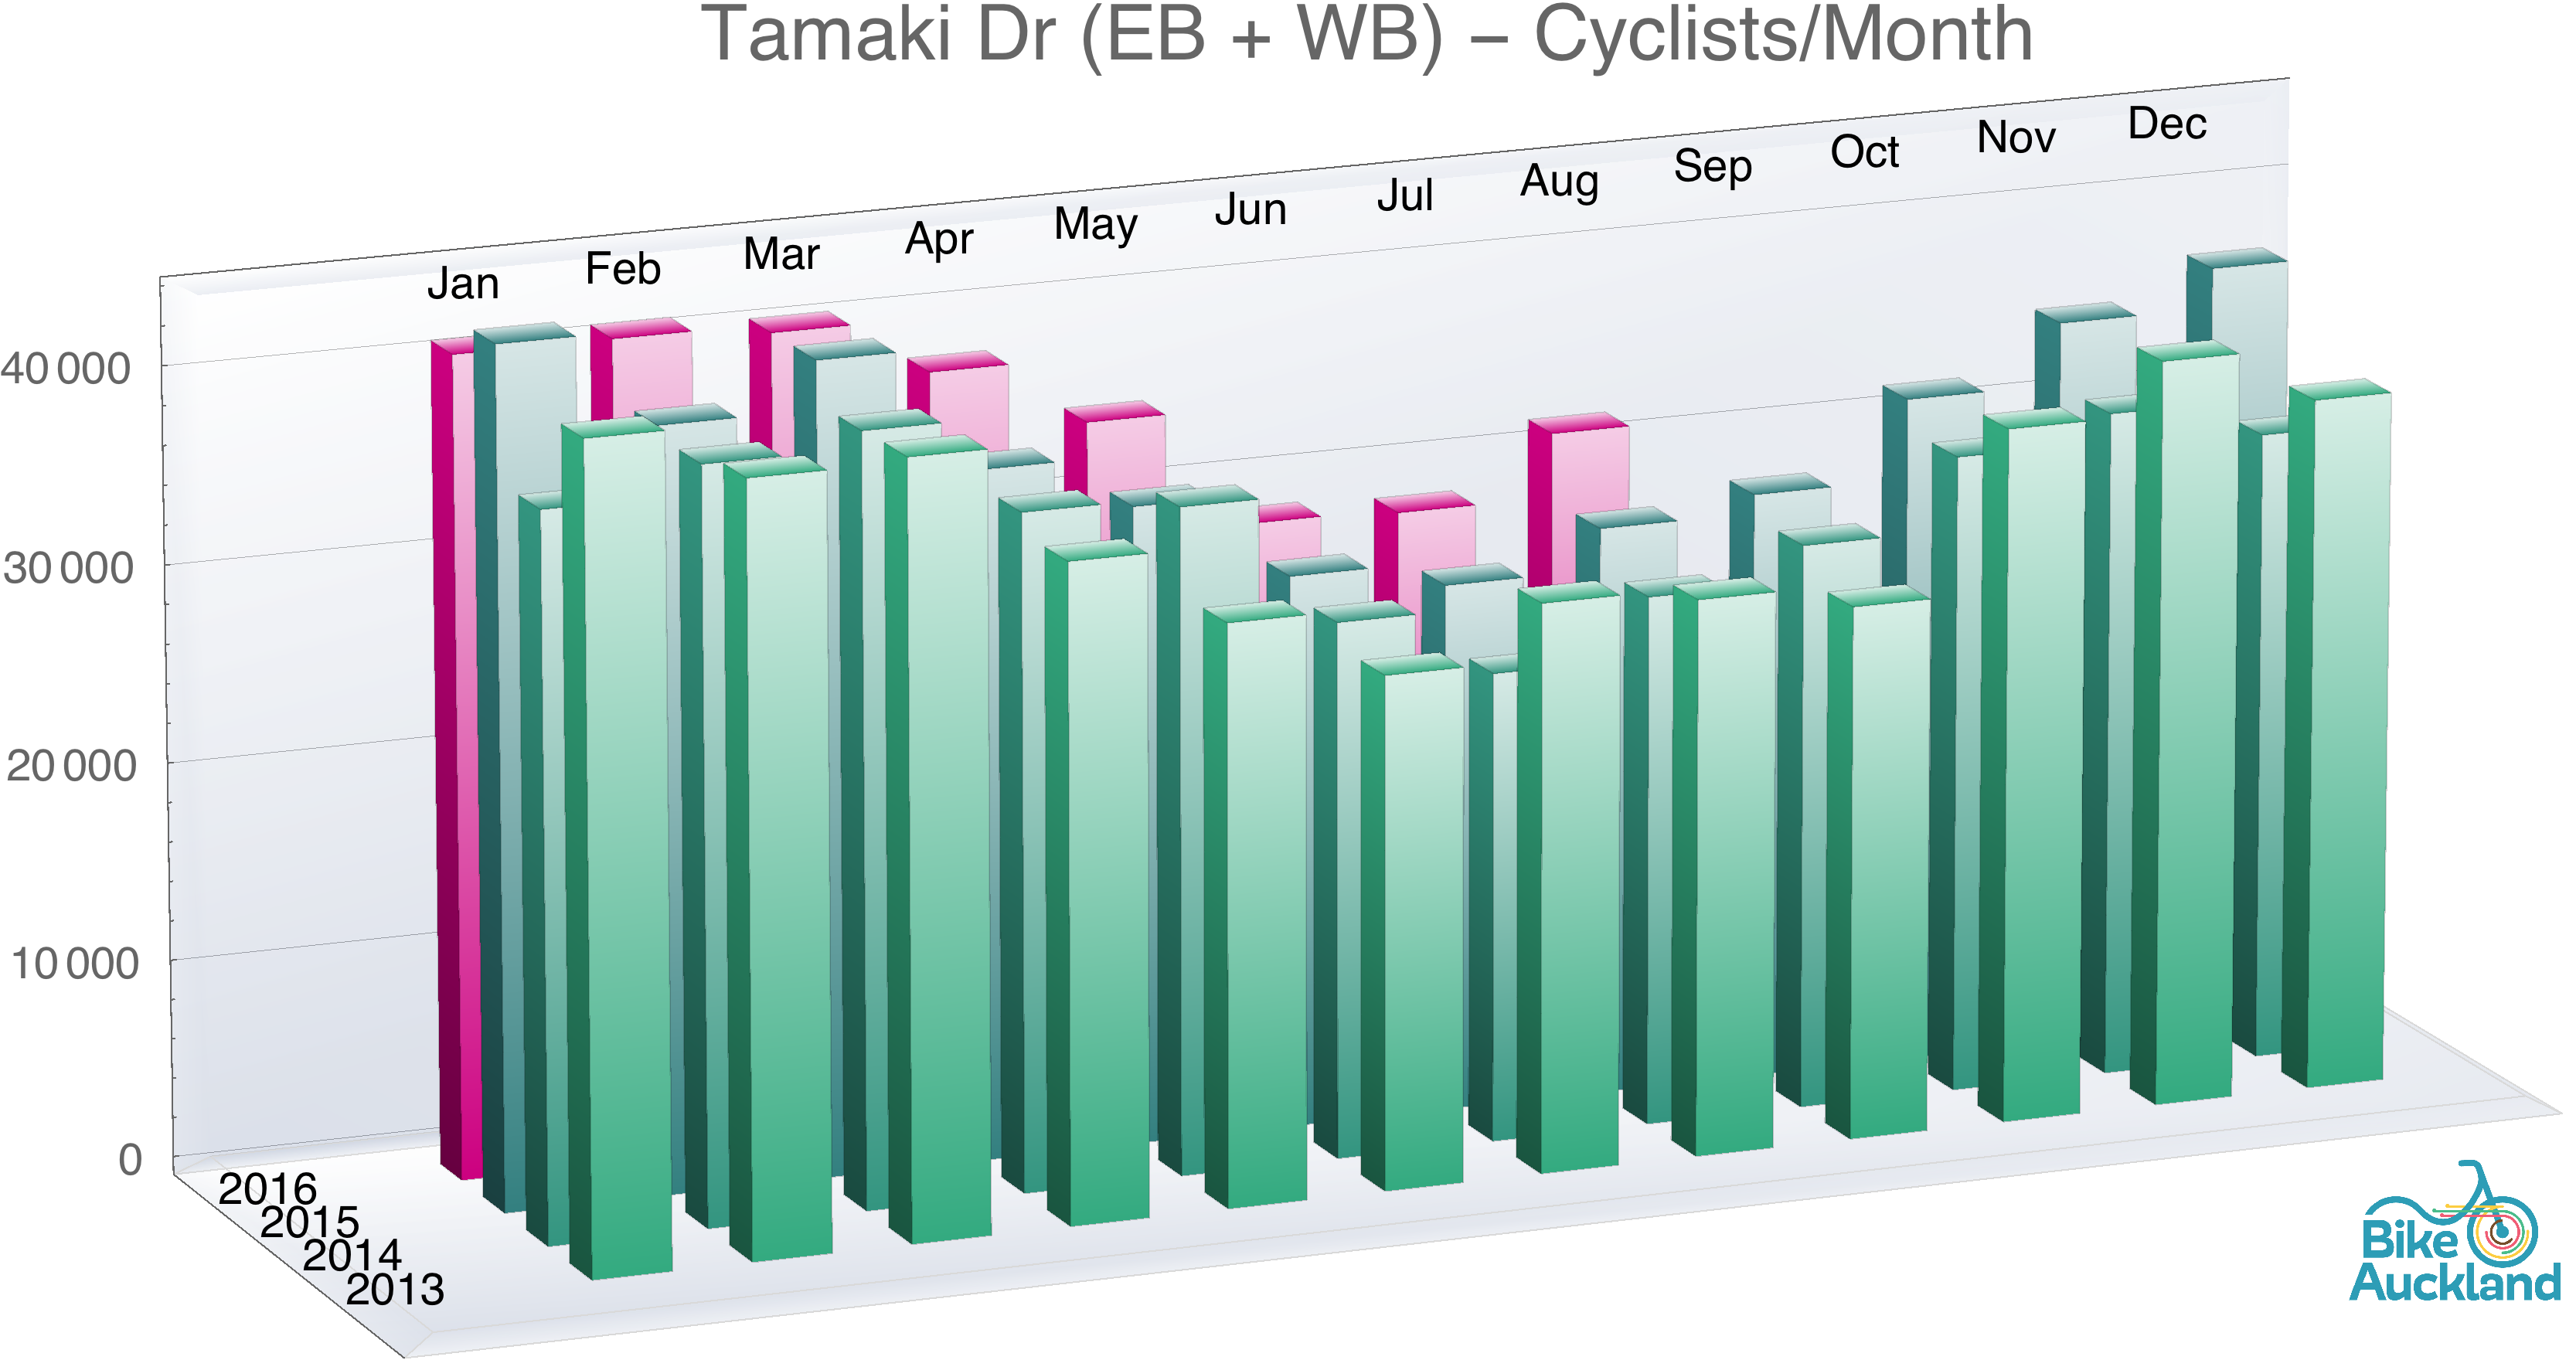
- The steady gainers: Like Tamaki Drive – our busiest cycle route shows continuing 12 month-rolling growth!
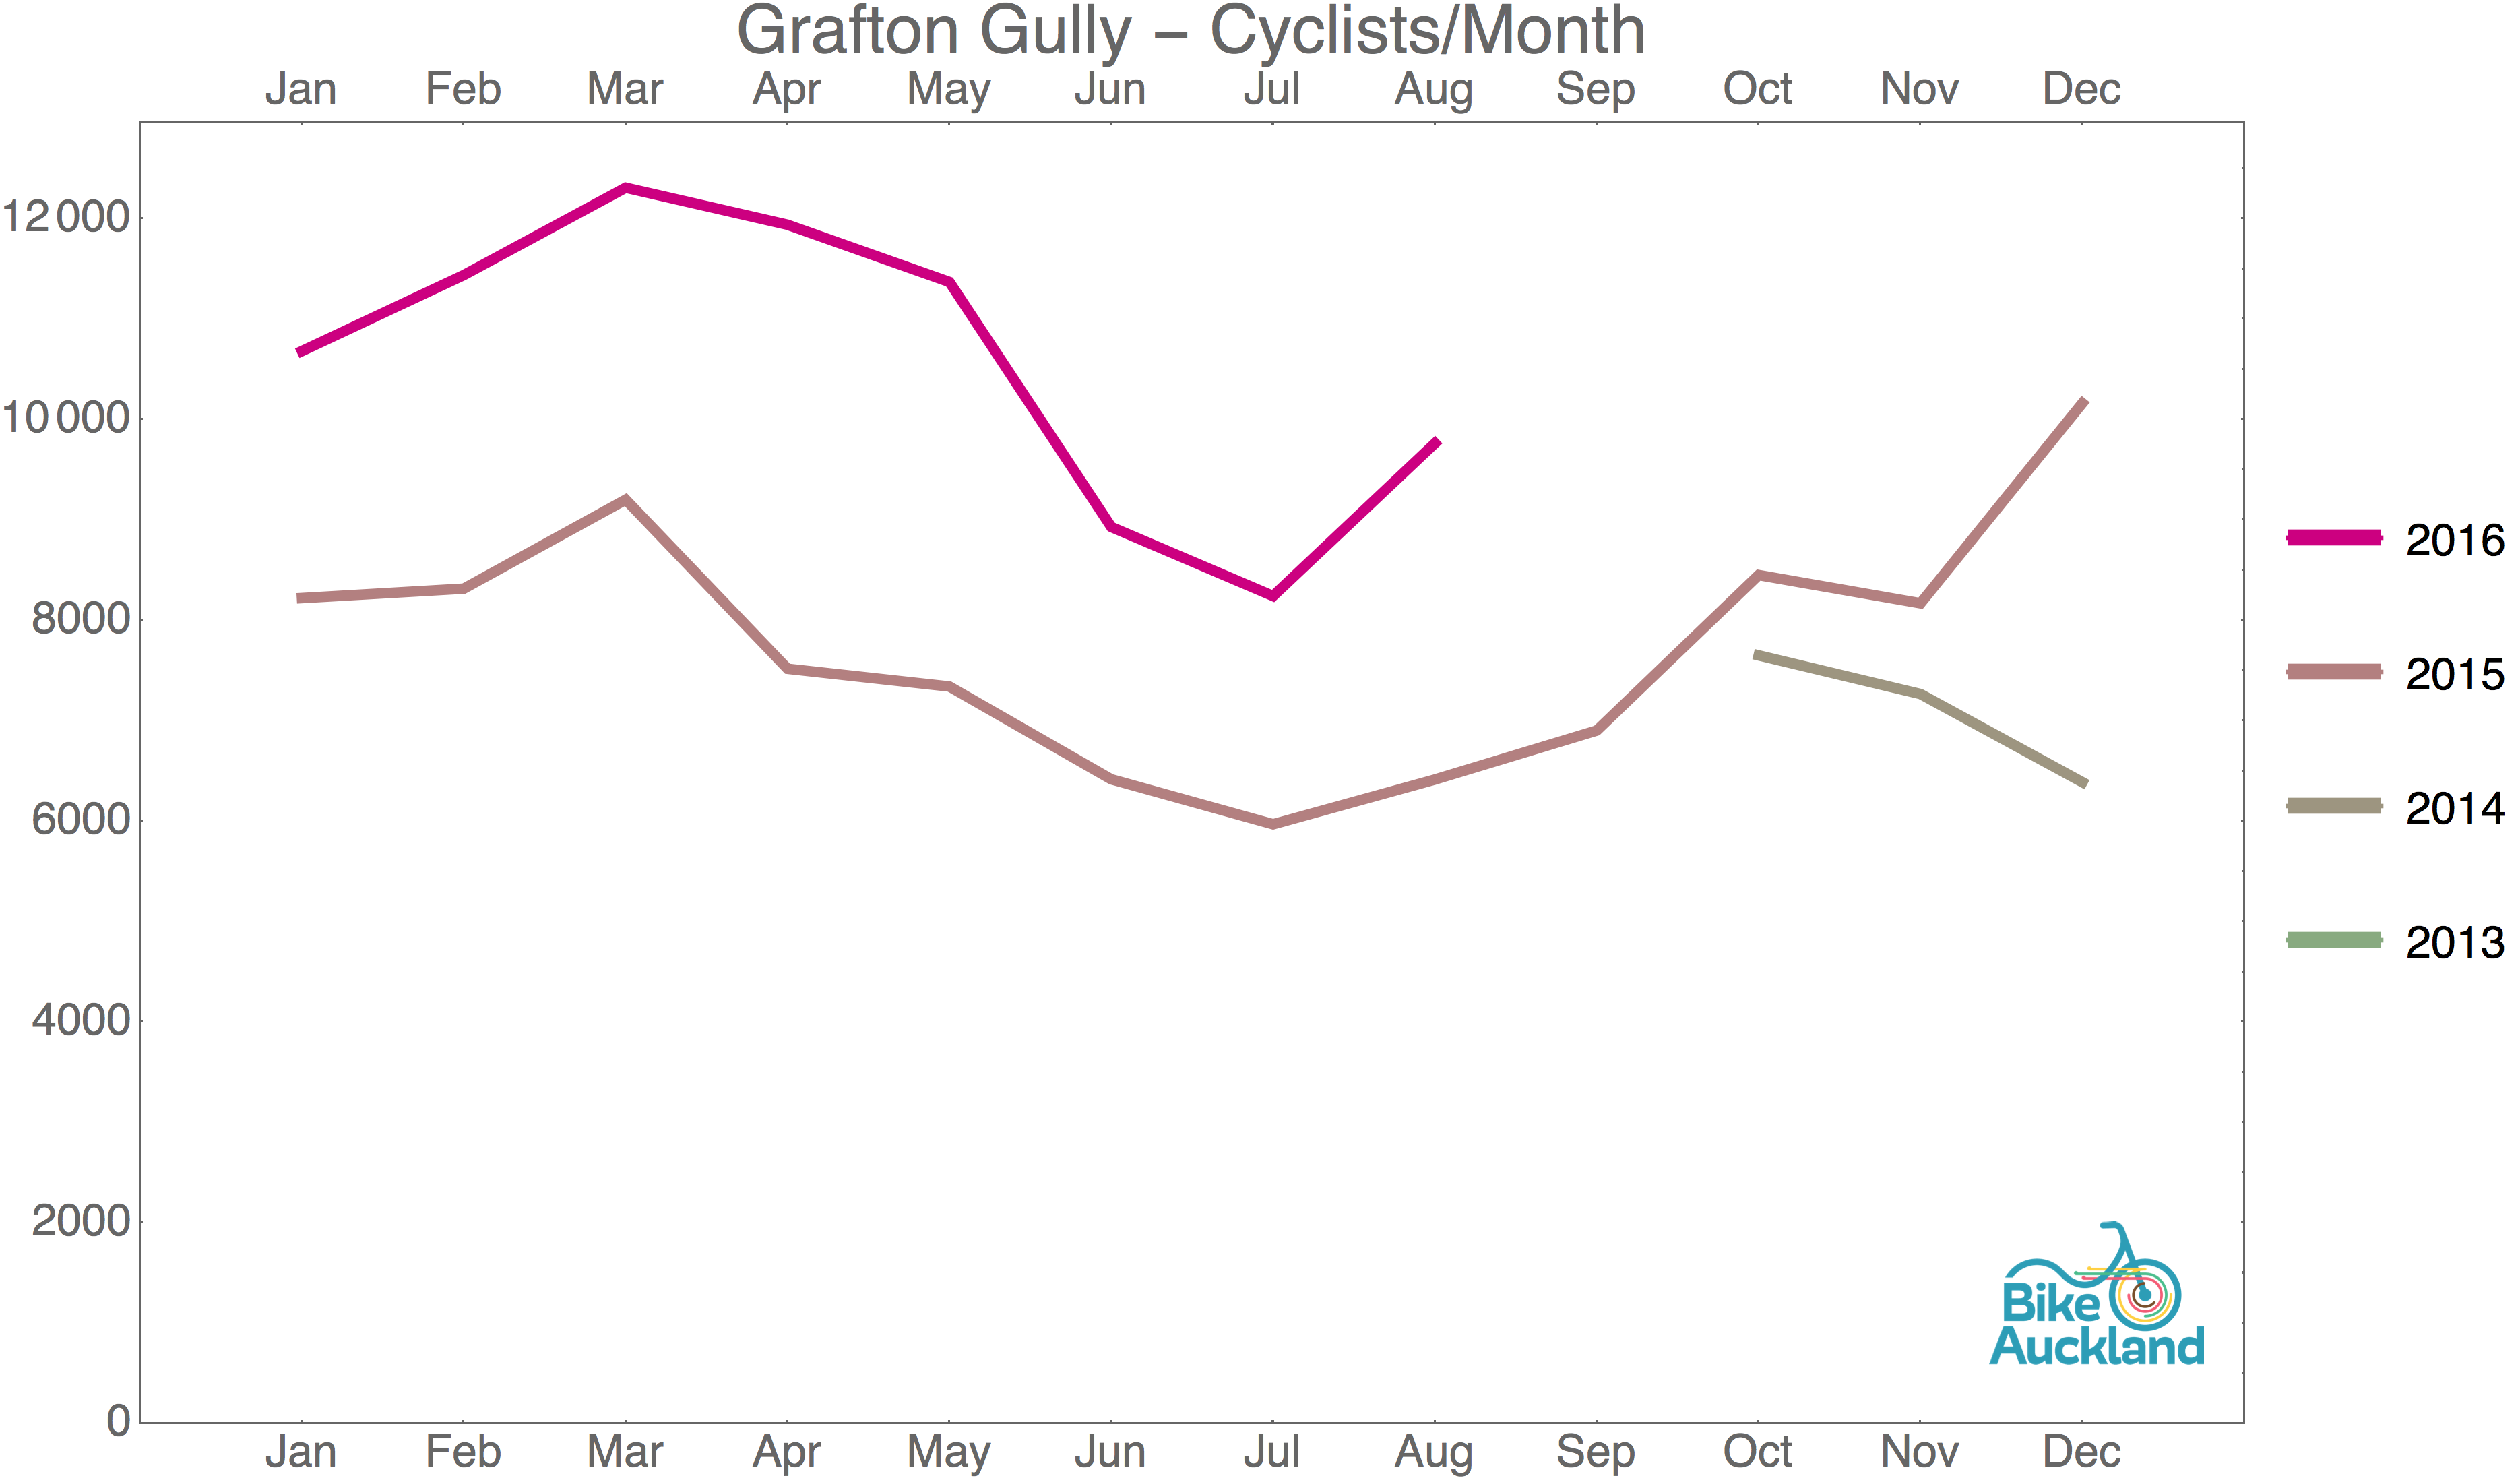
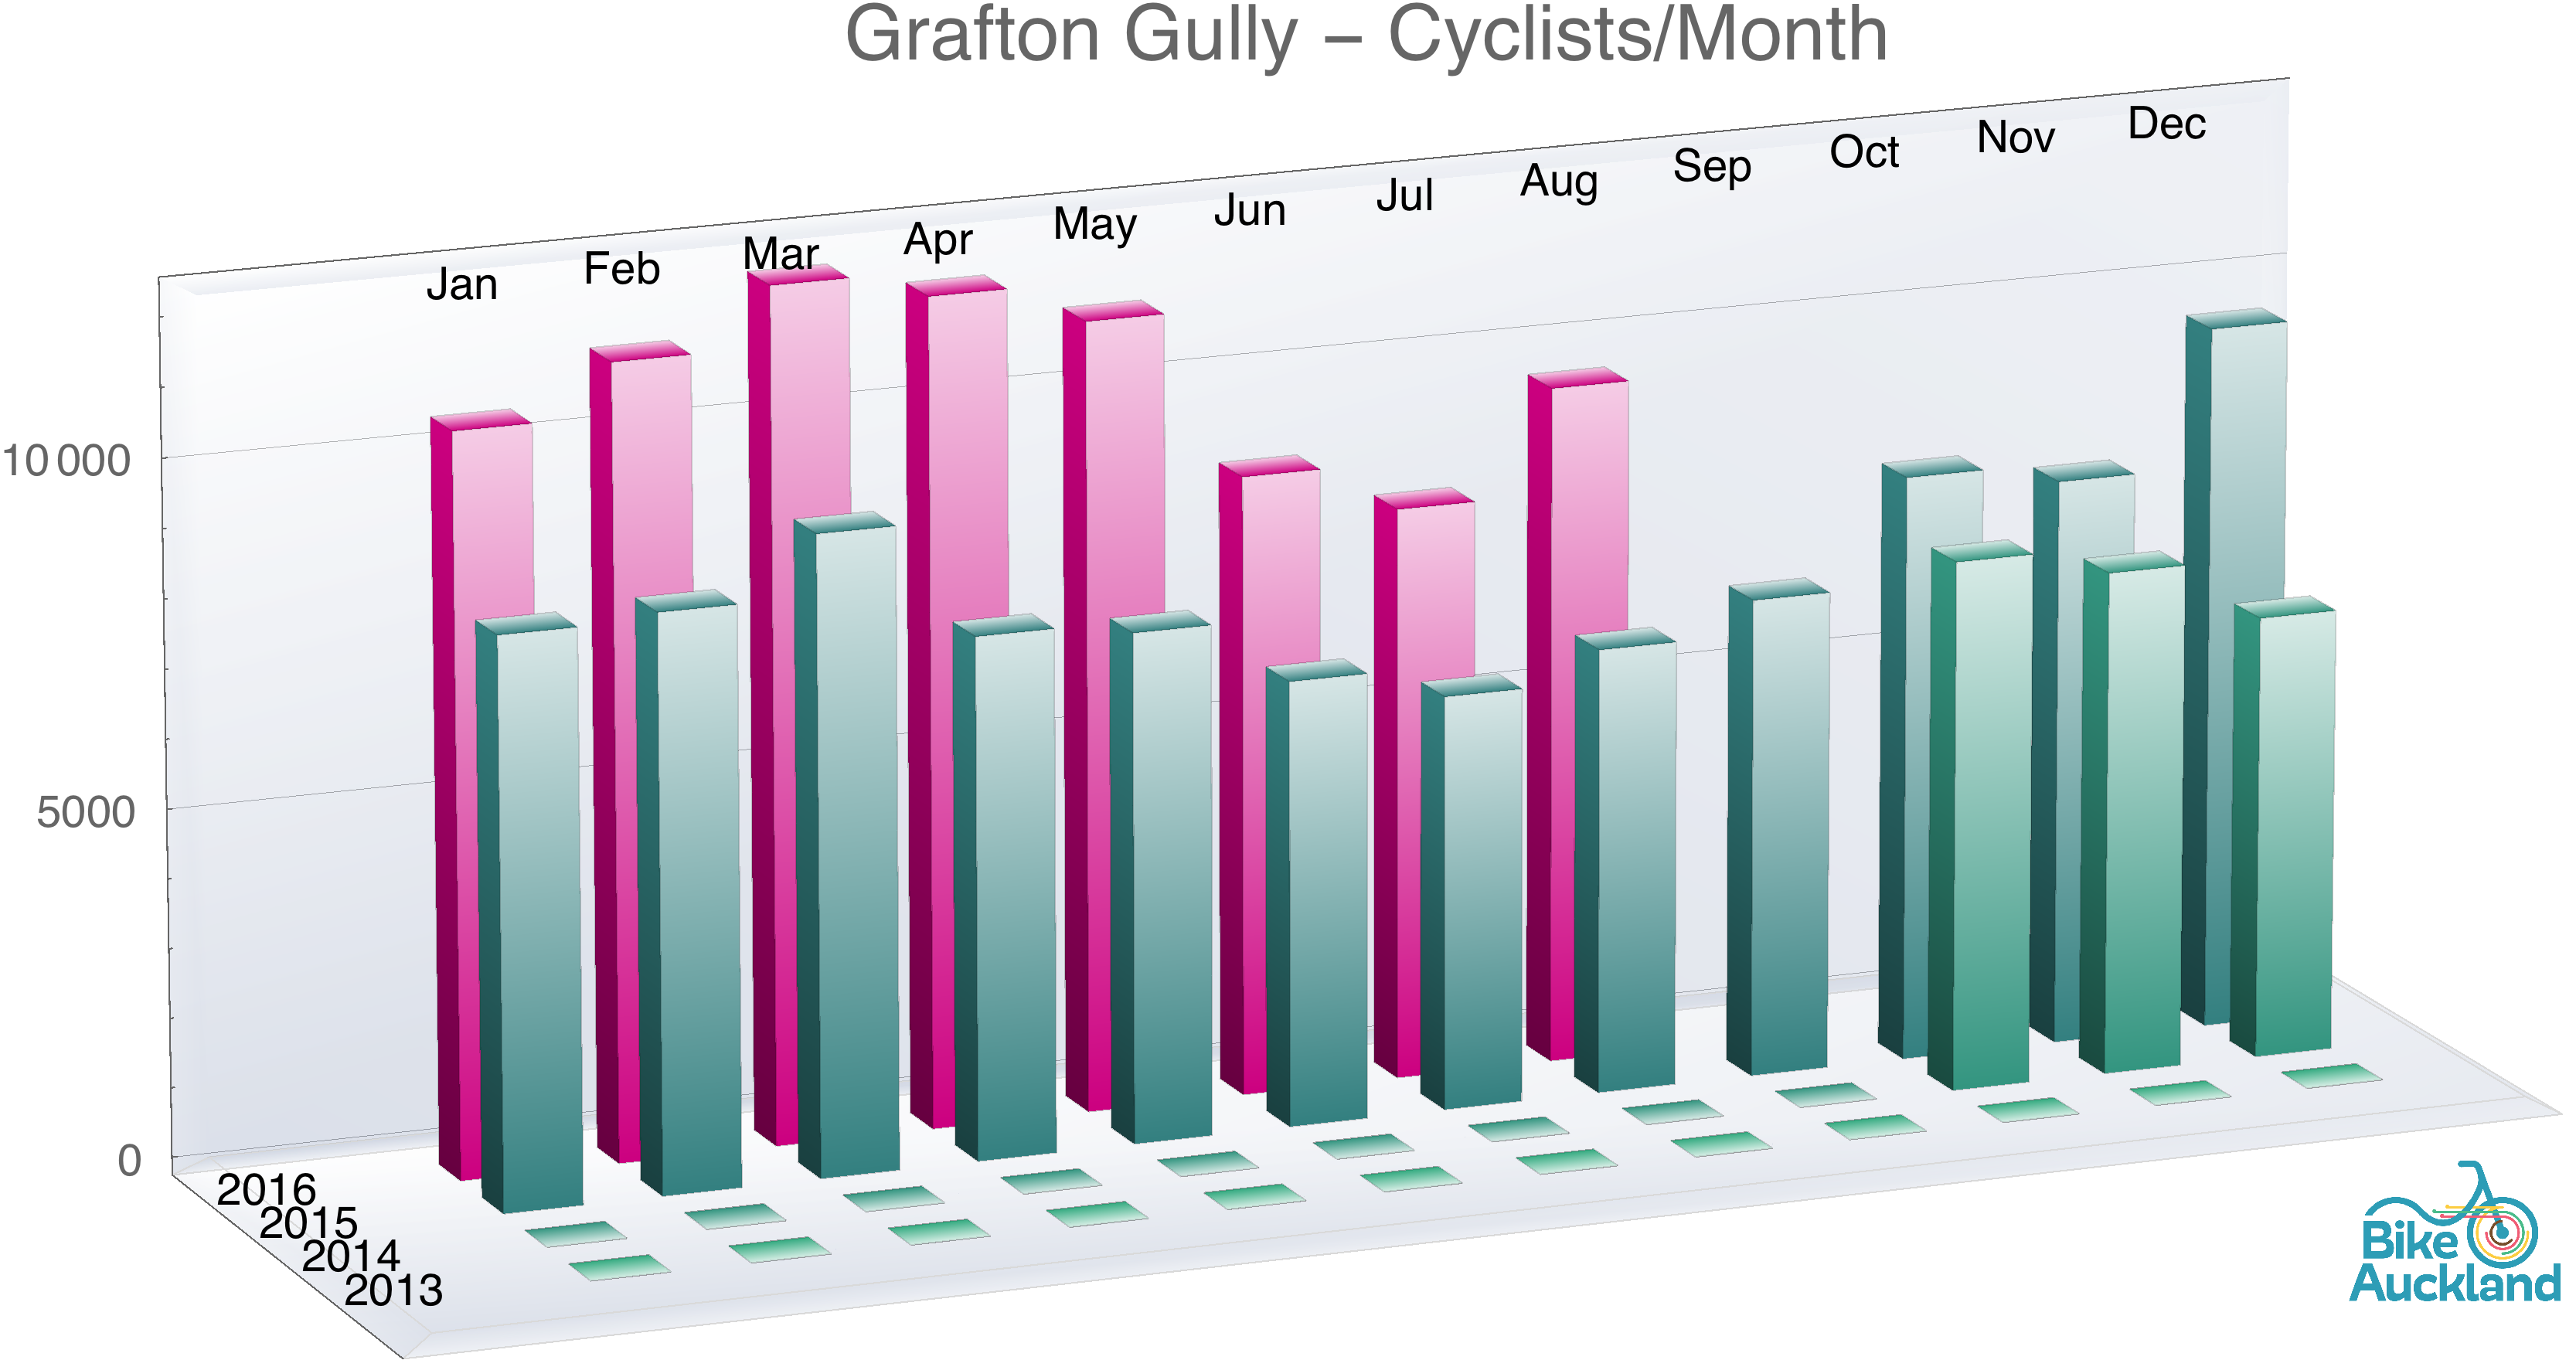
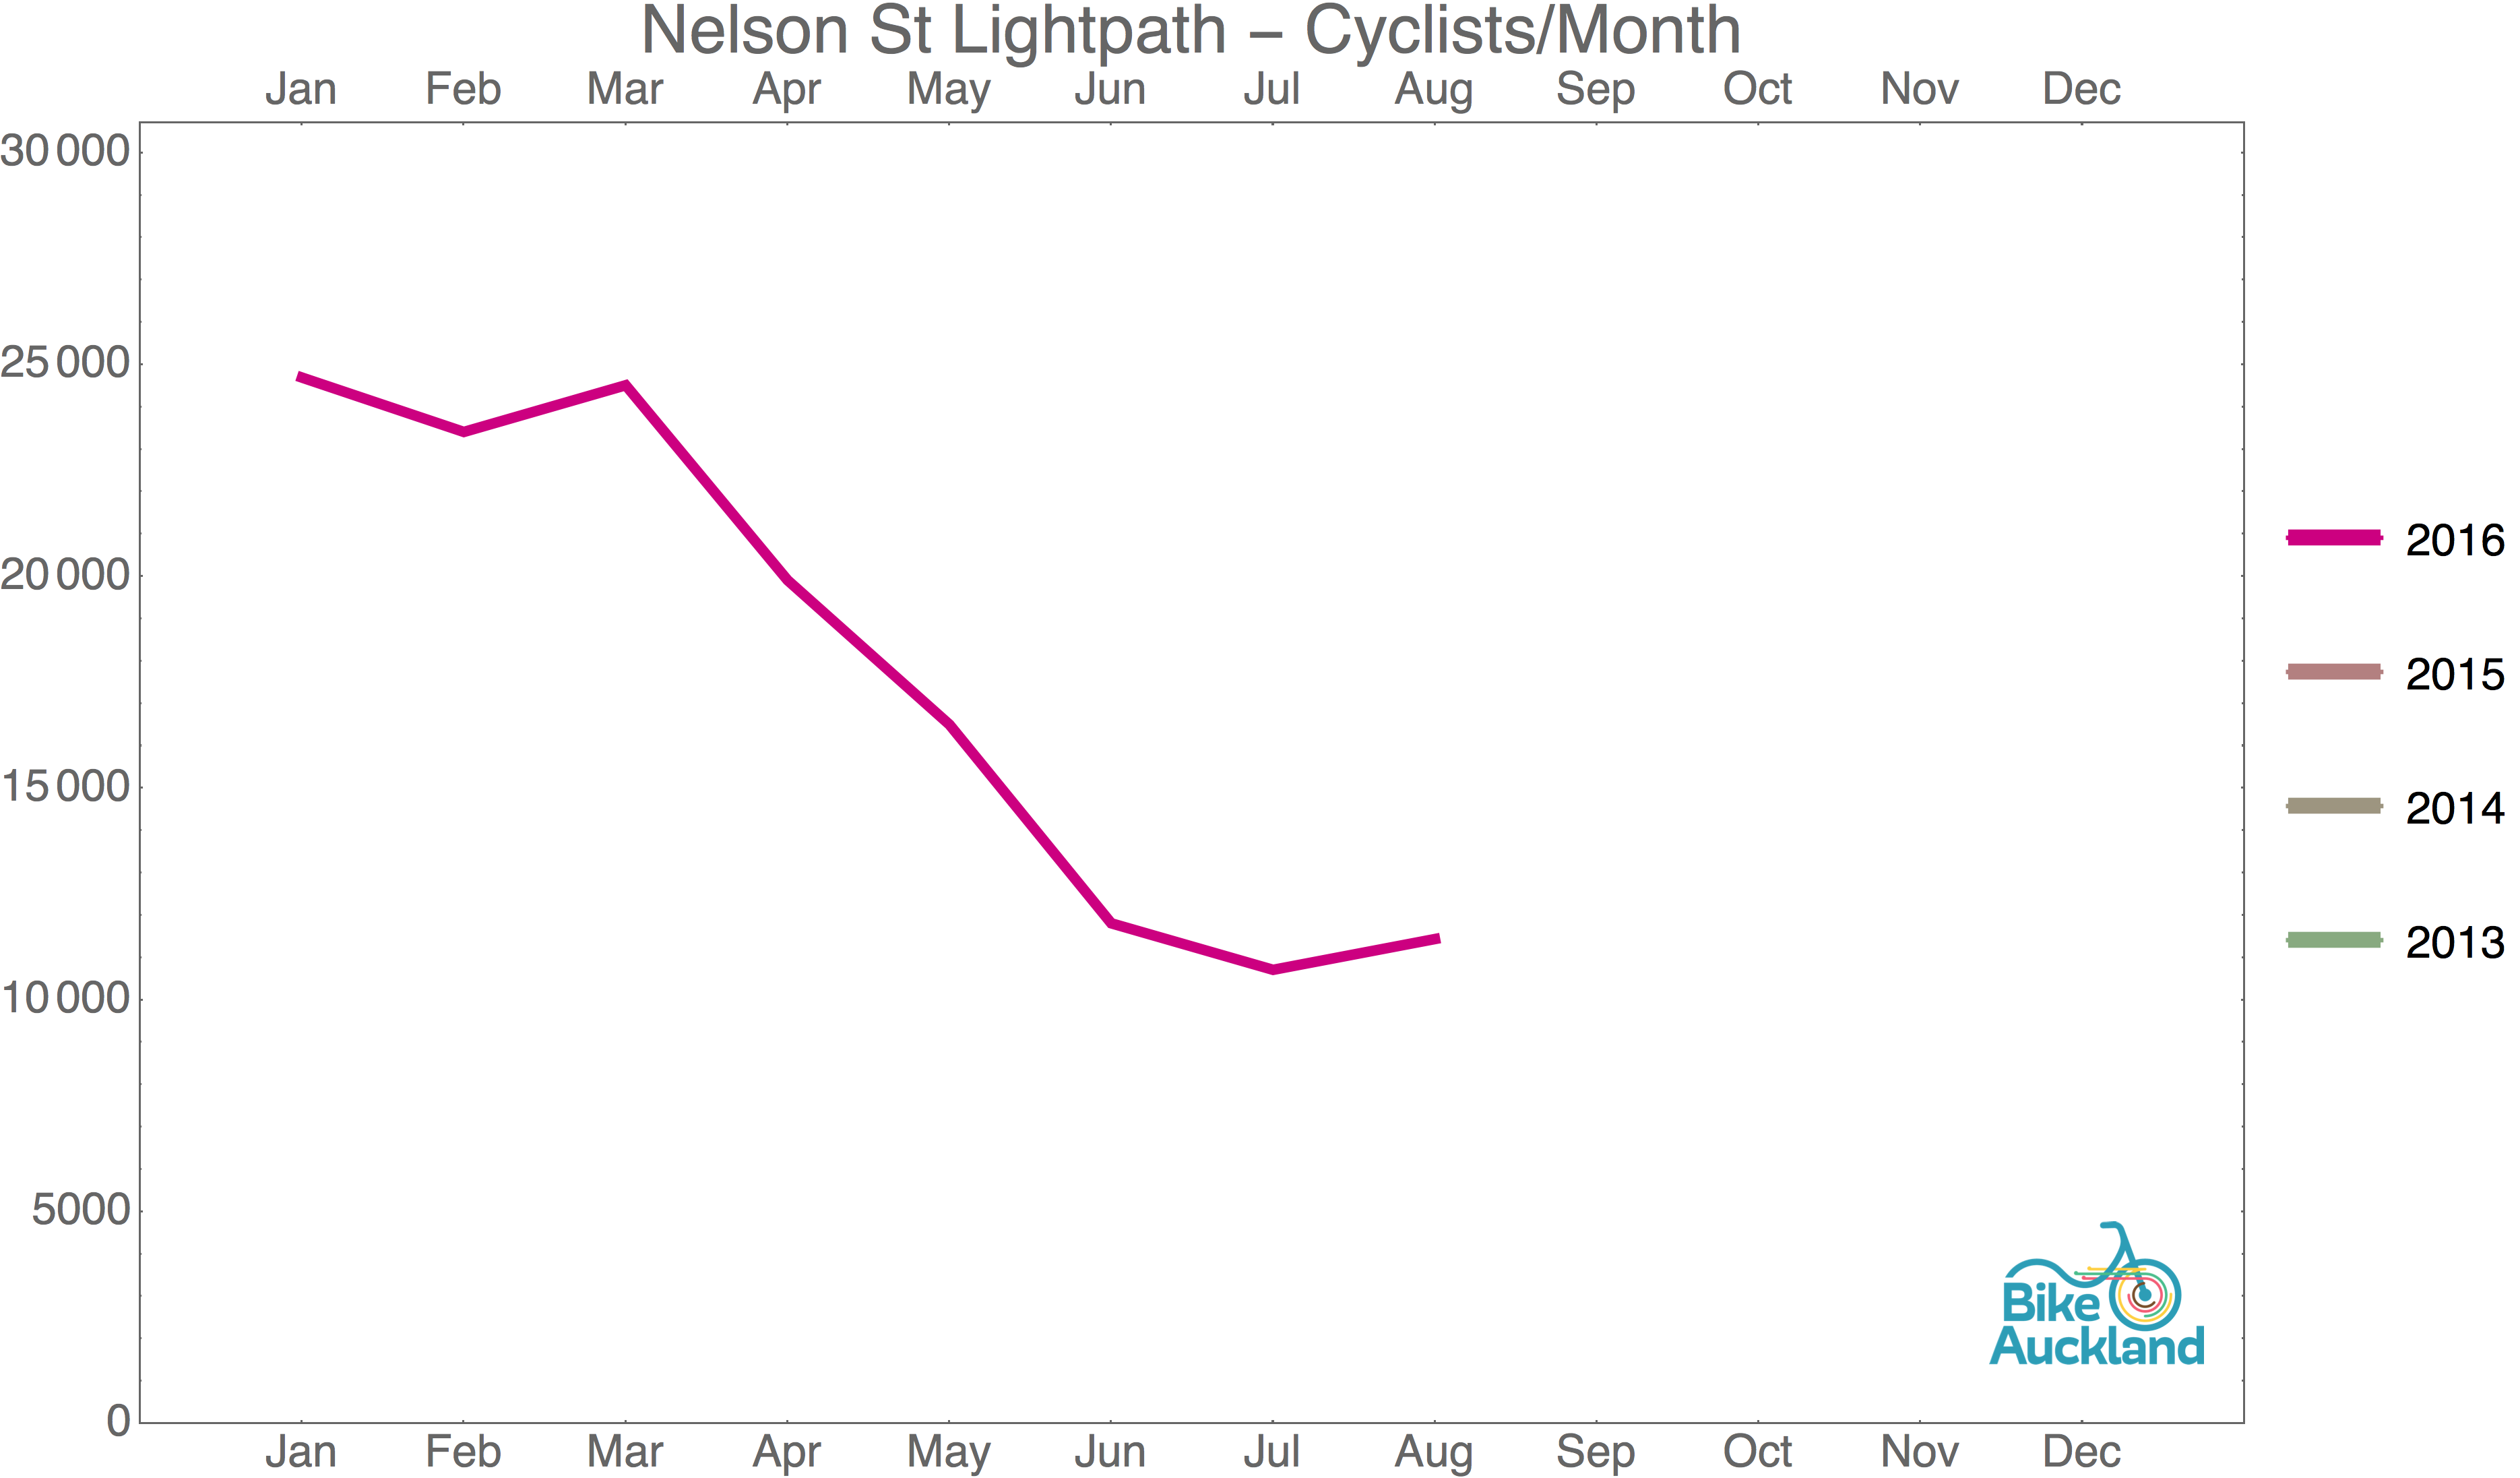
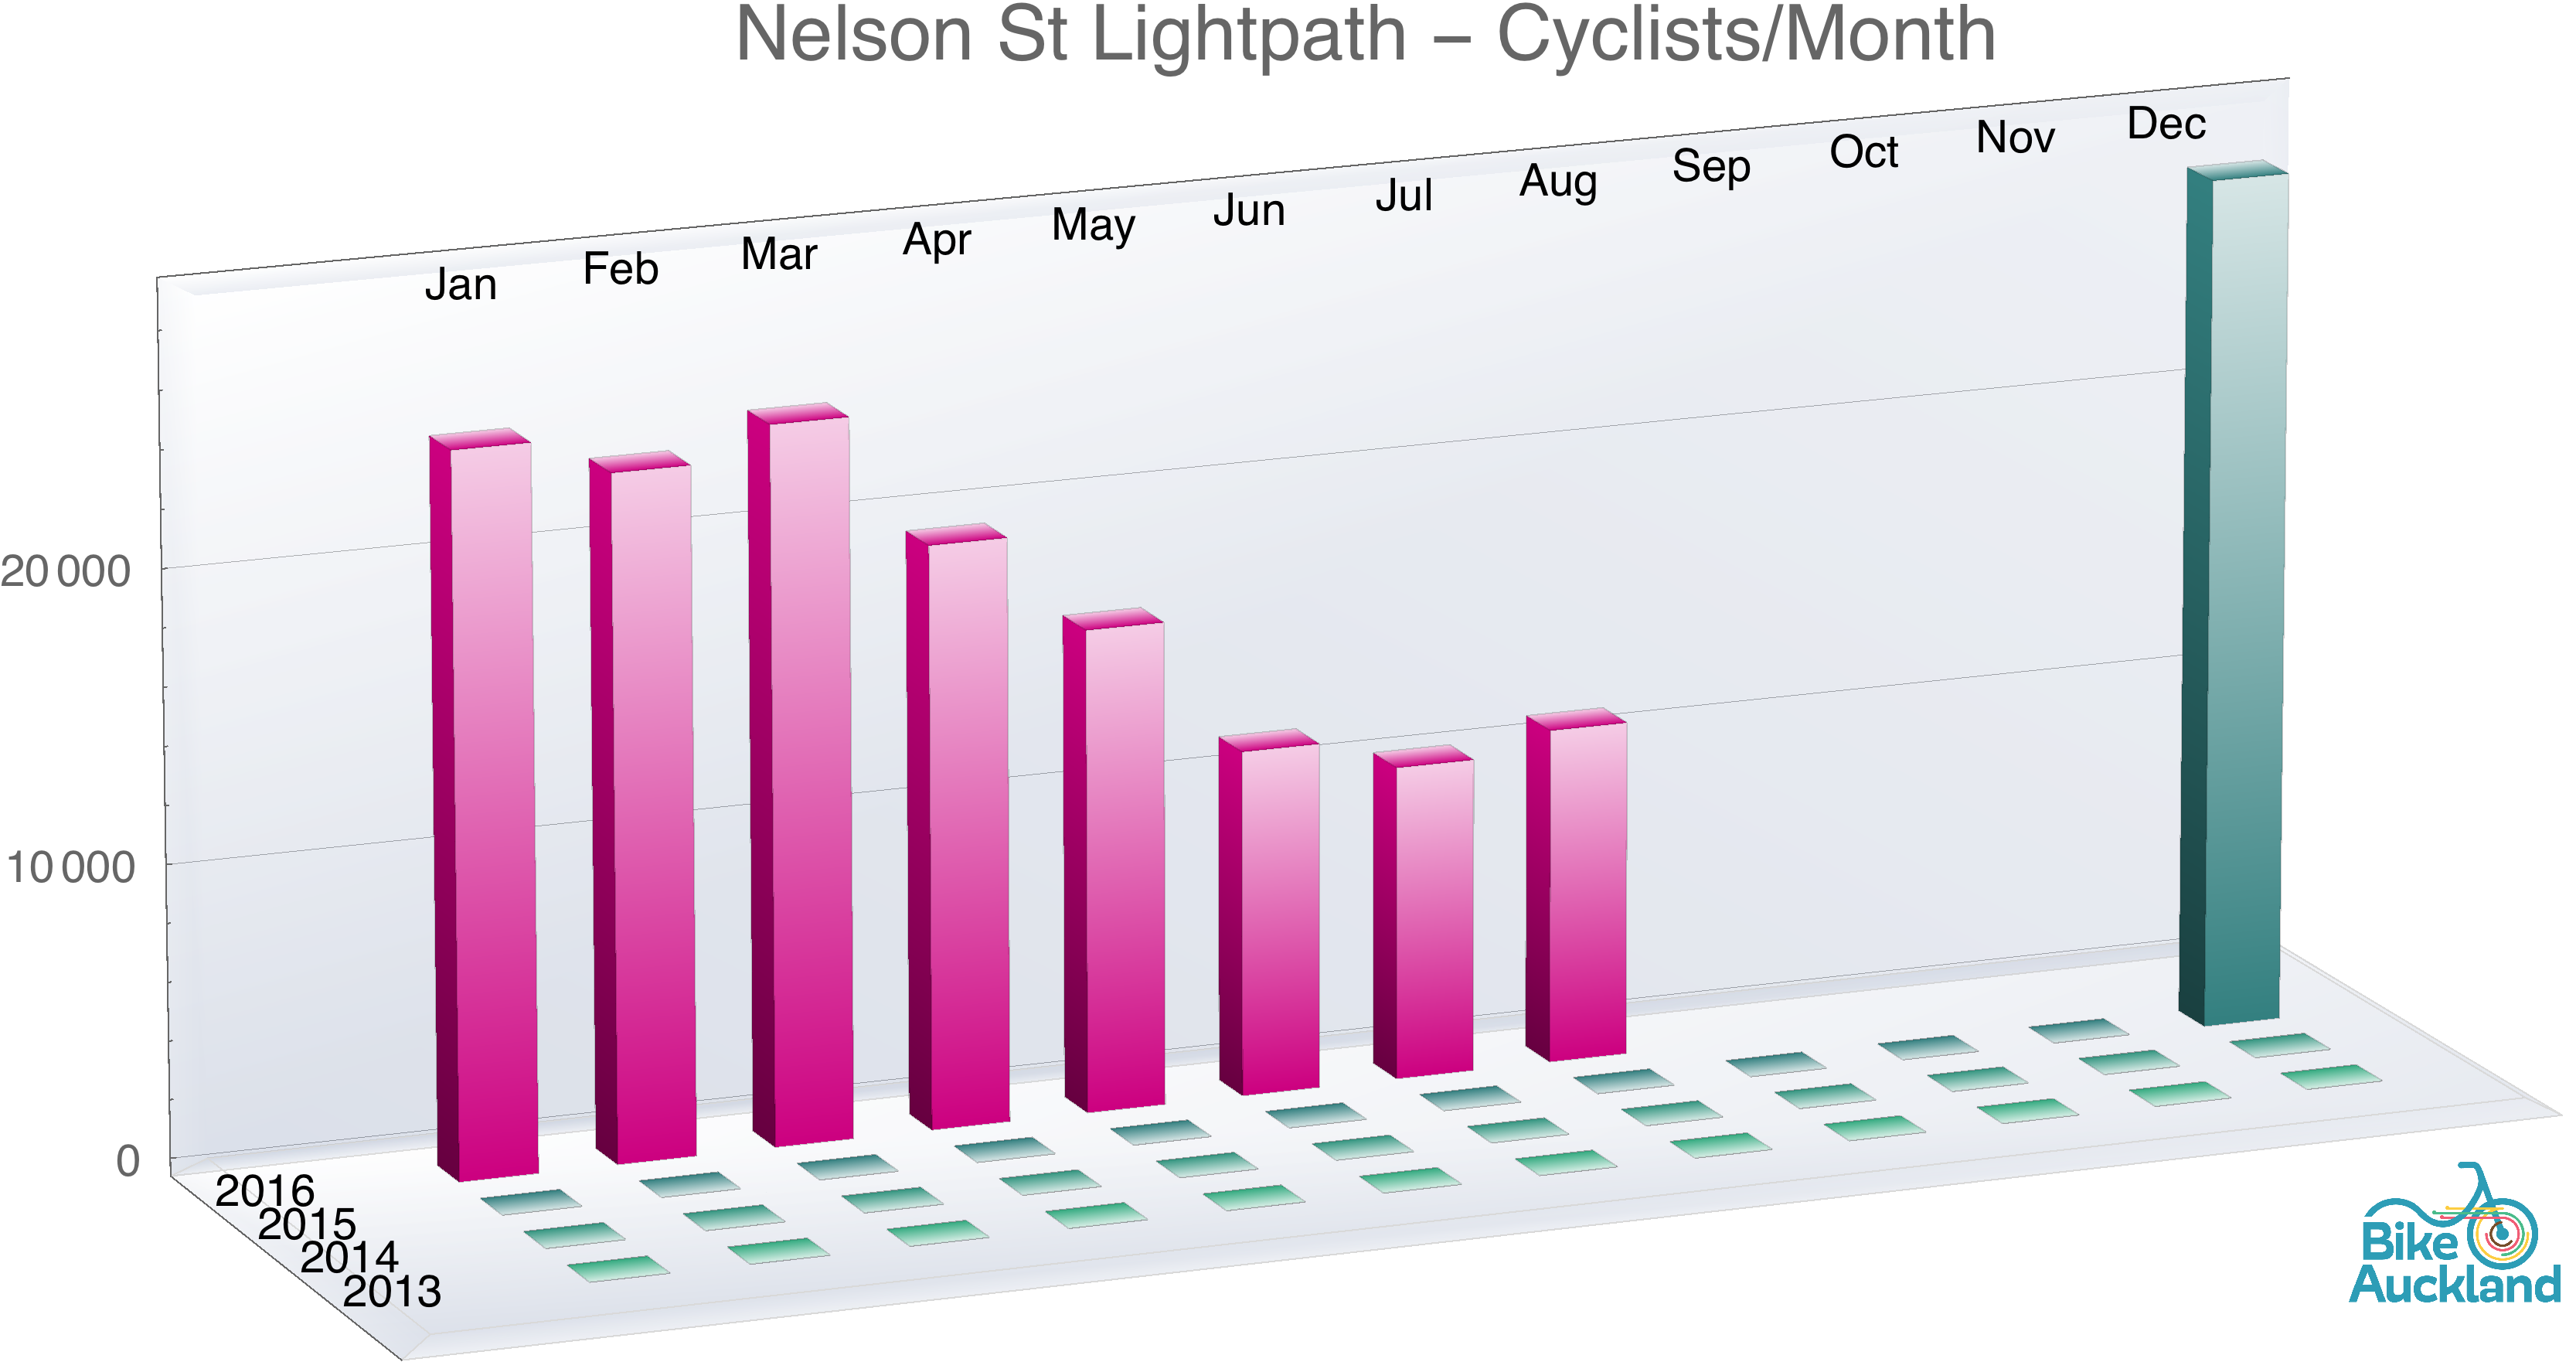
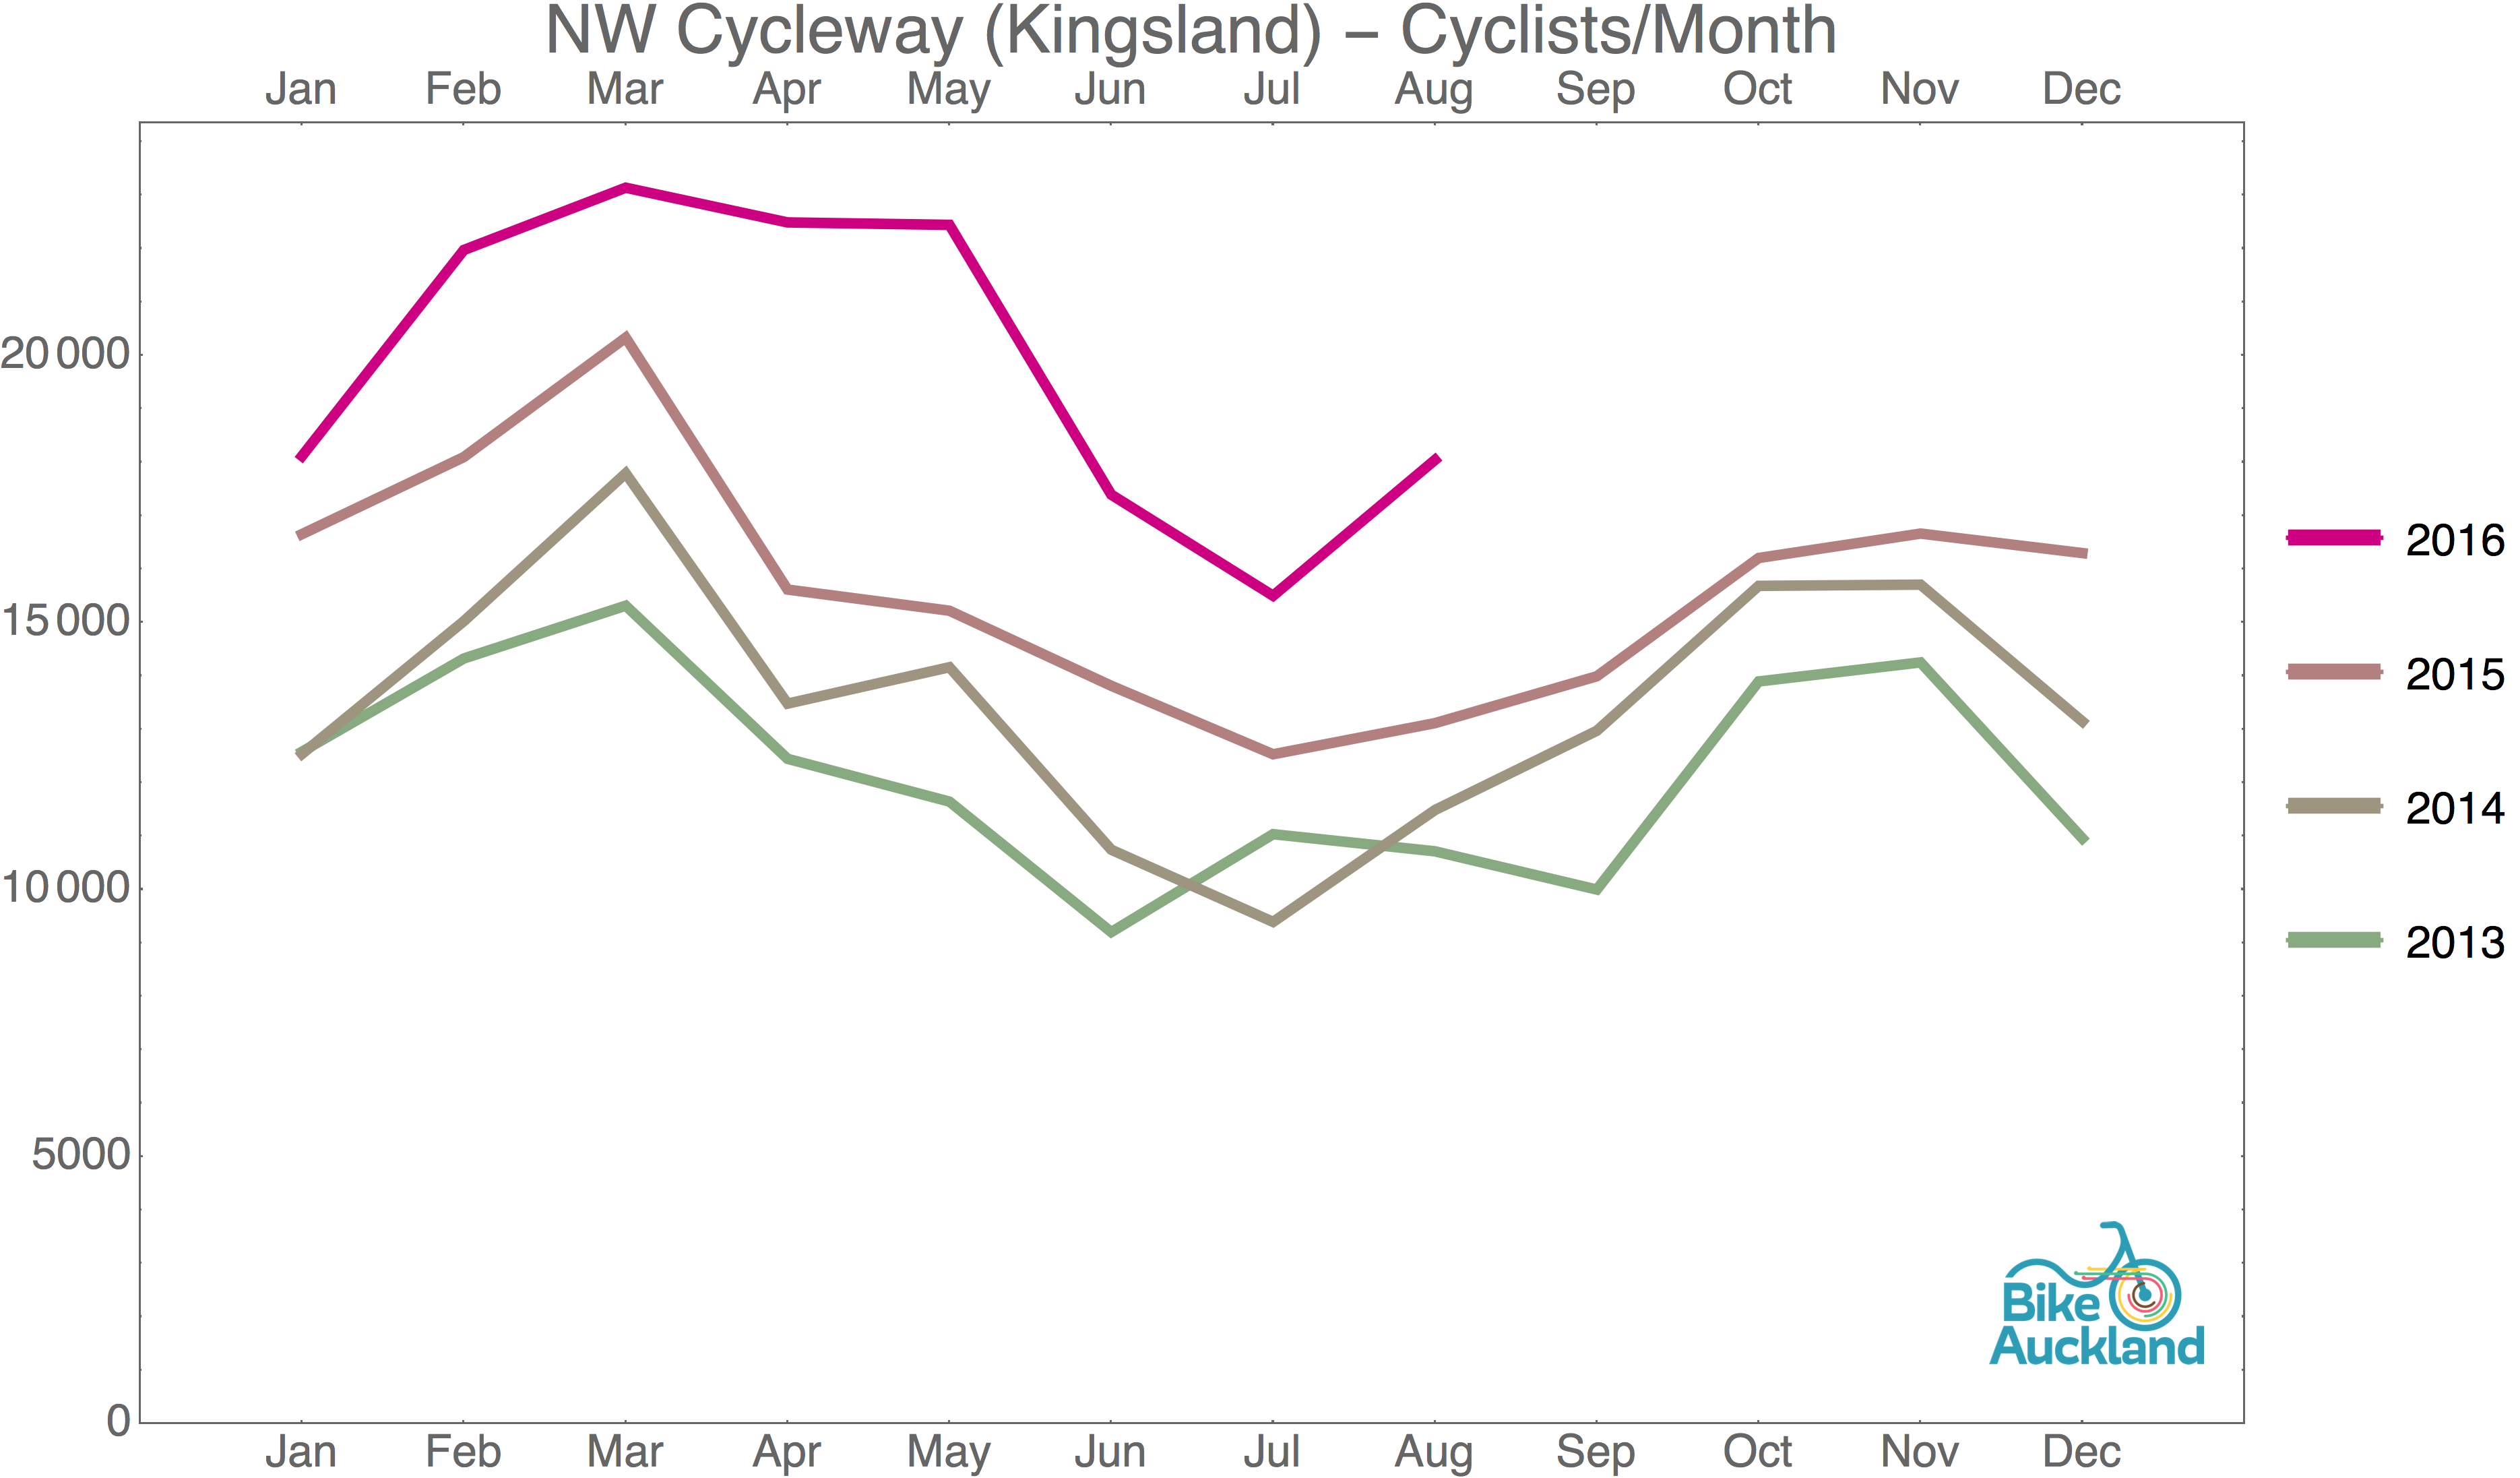
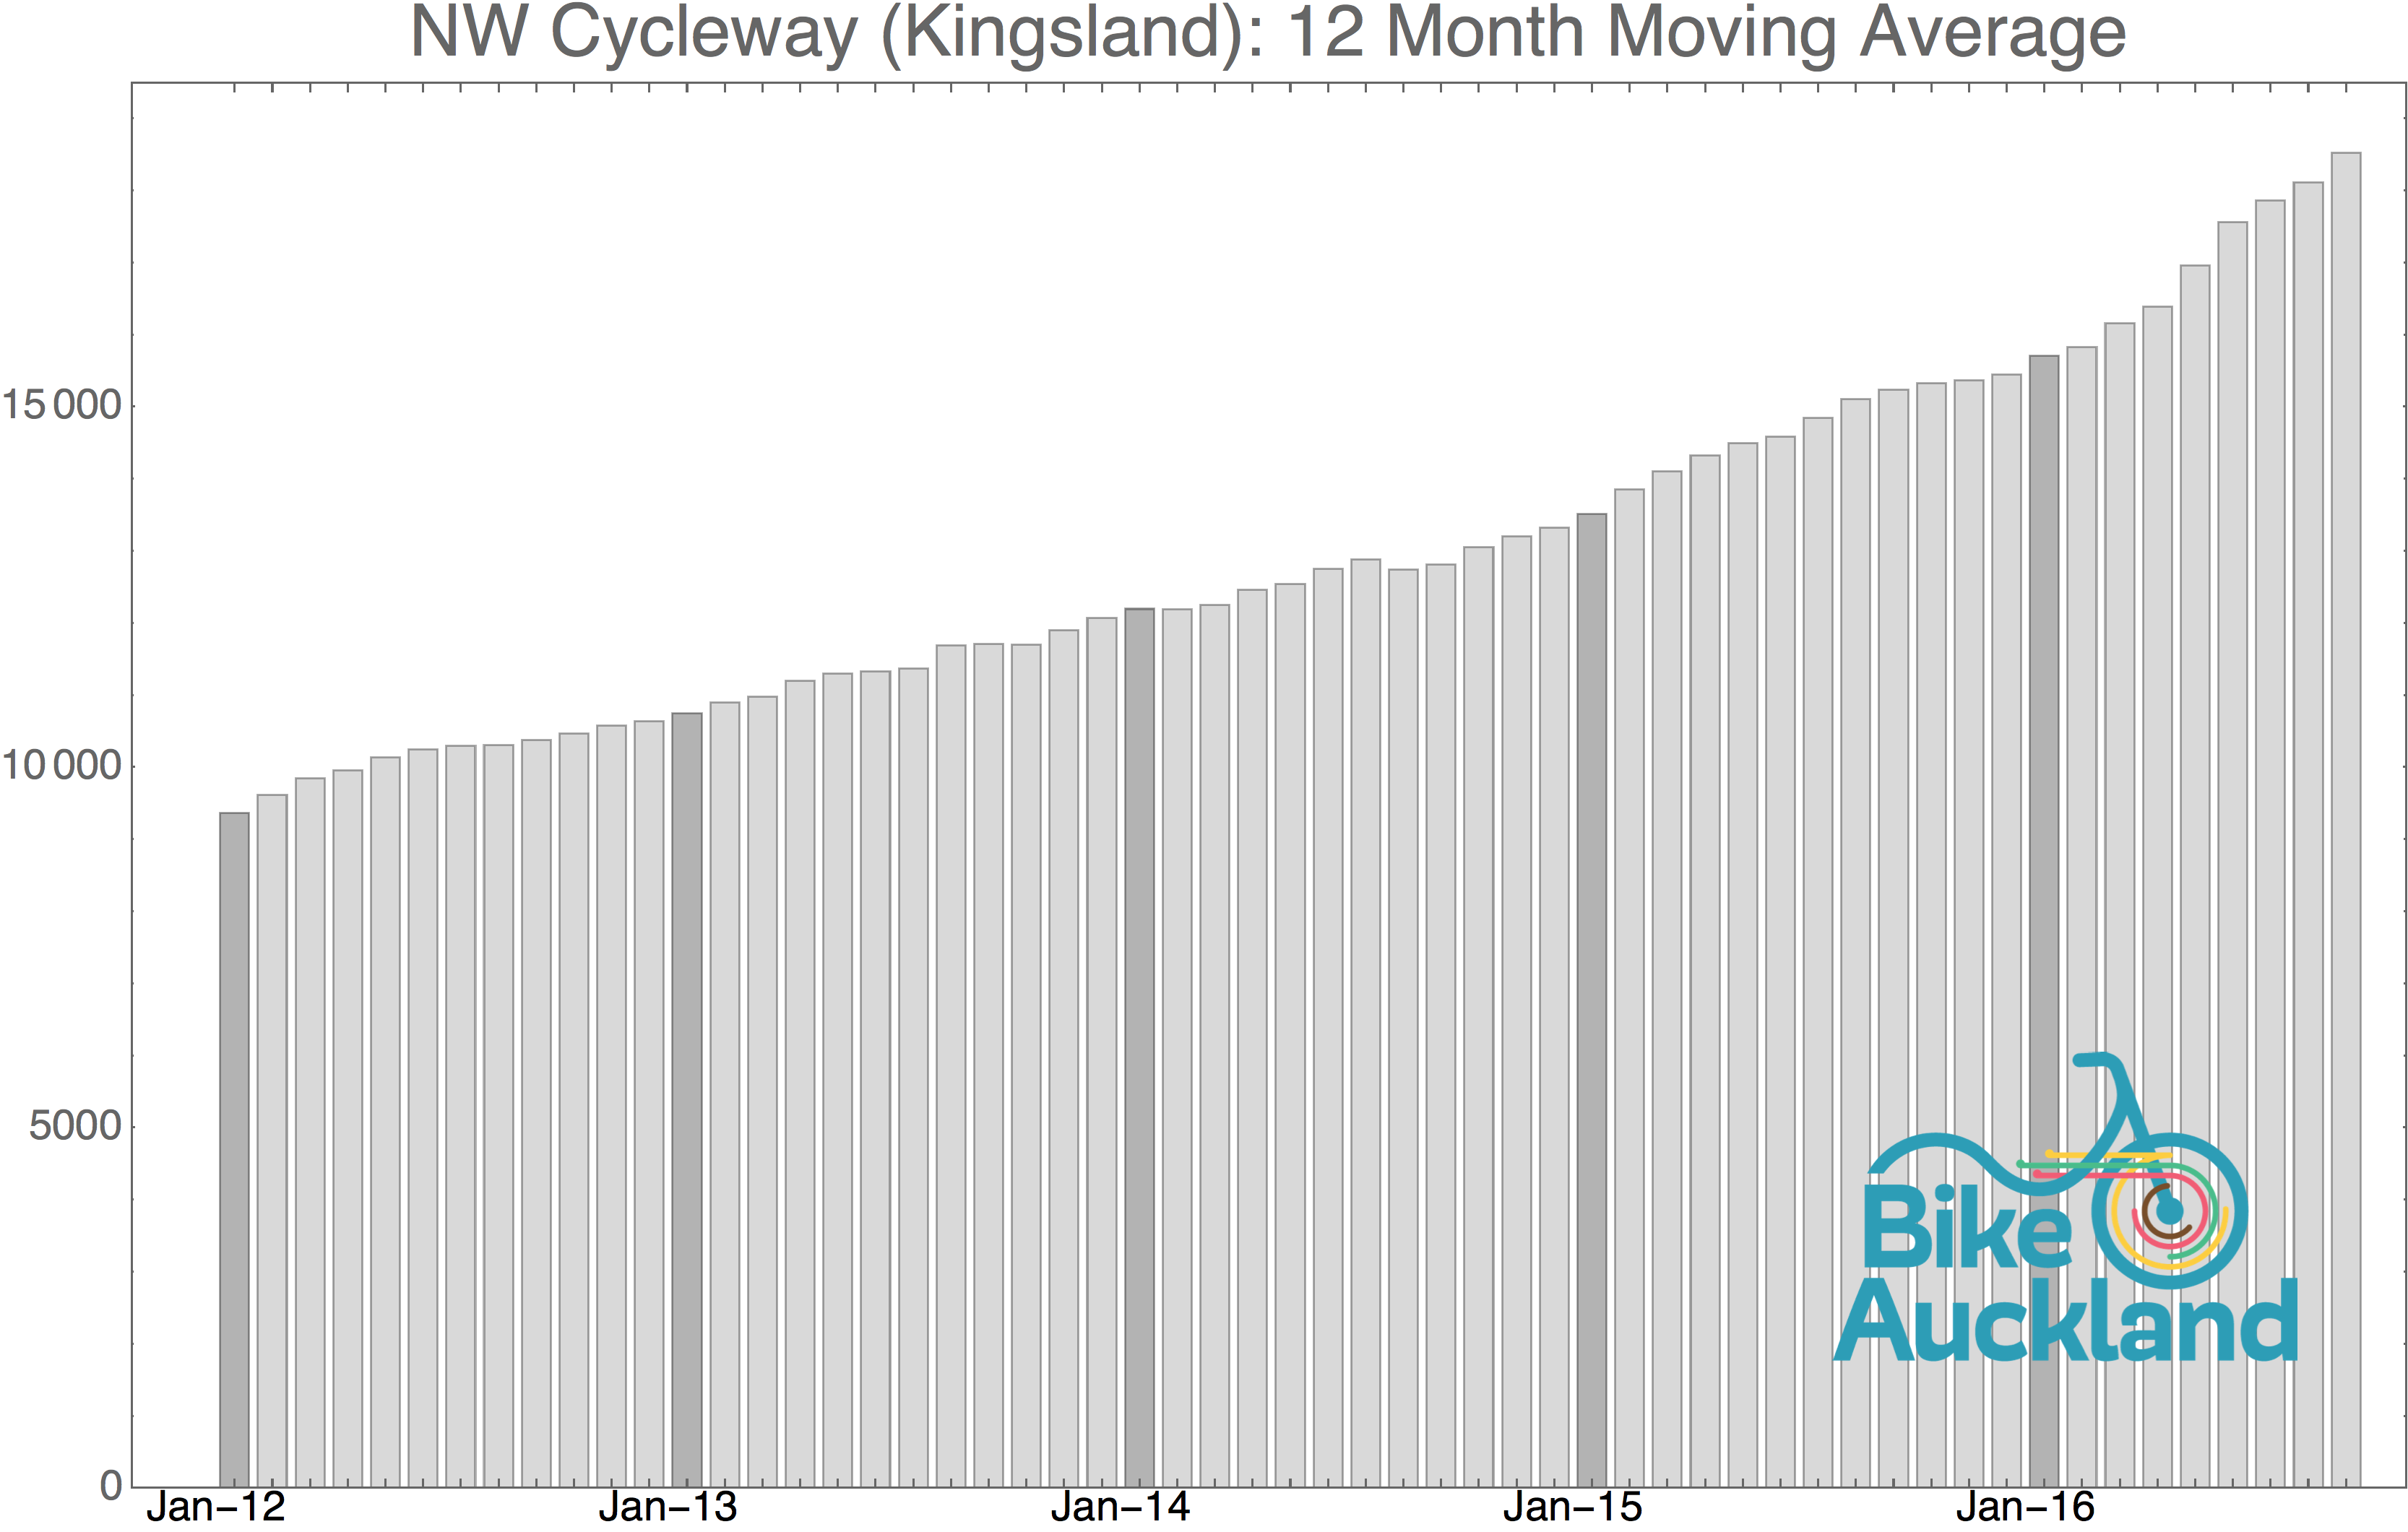
- The outstanding ones: Mainly the Northwestern Cycleway, where Grafton Gully and Lightpath have caused numbers to take off!
Tell us what you see in the numbers! (By the way, all the diagrams in this blog post are released as Creative Commons Attribution 4.0, so feel free to re-use them as much as you like according to that license).
Click on any graph to see at full size: