Things really are on the way up, when it comes to cycling. Not only are there more people on bikes around town – there are more counters to keep track of them.
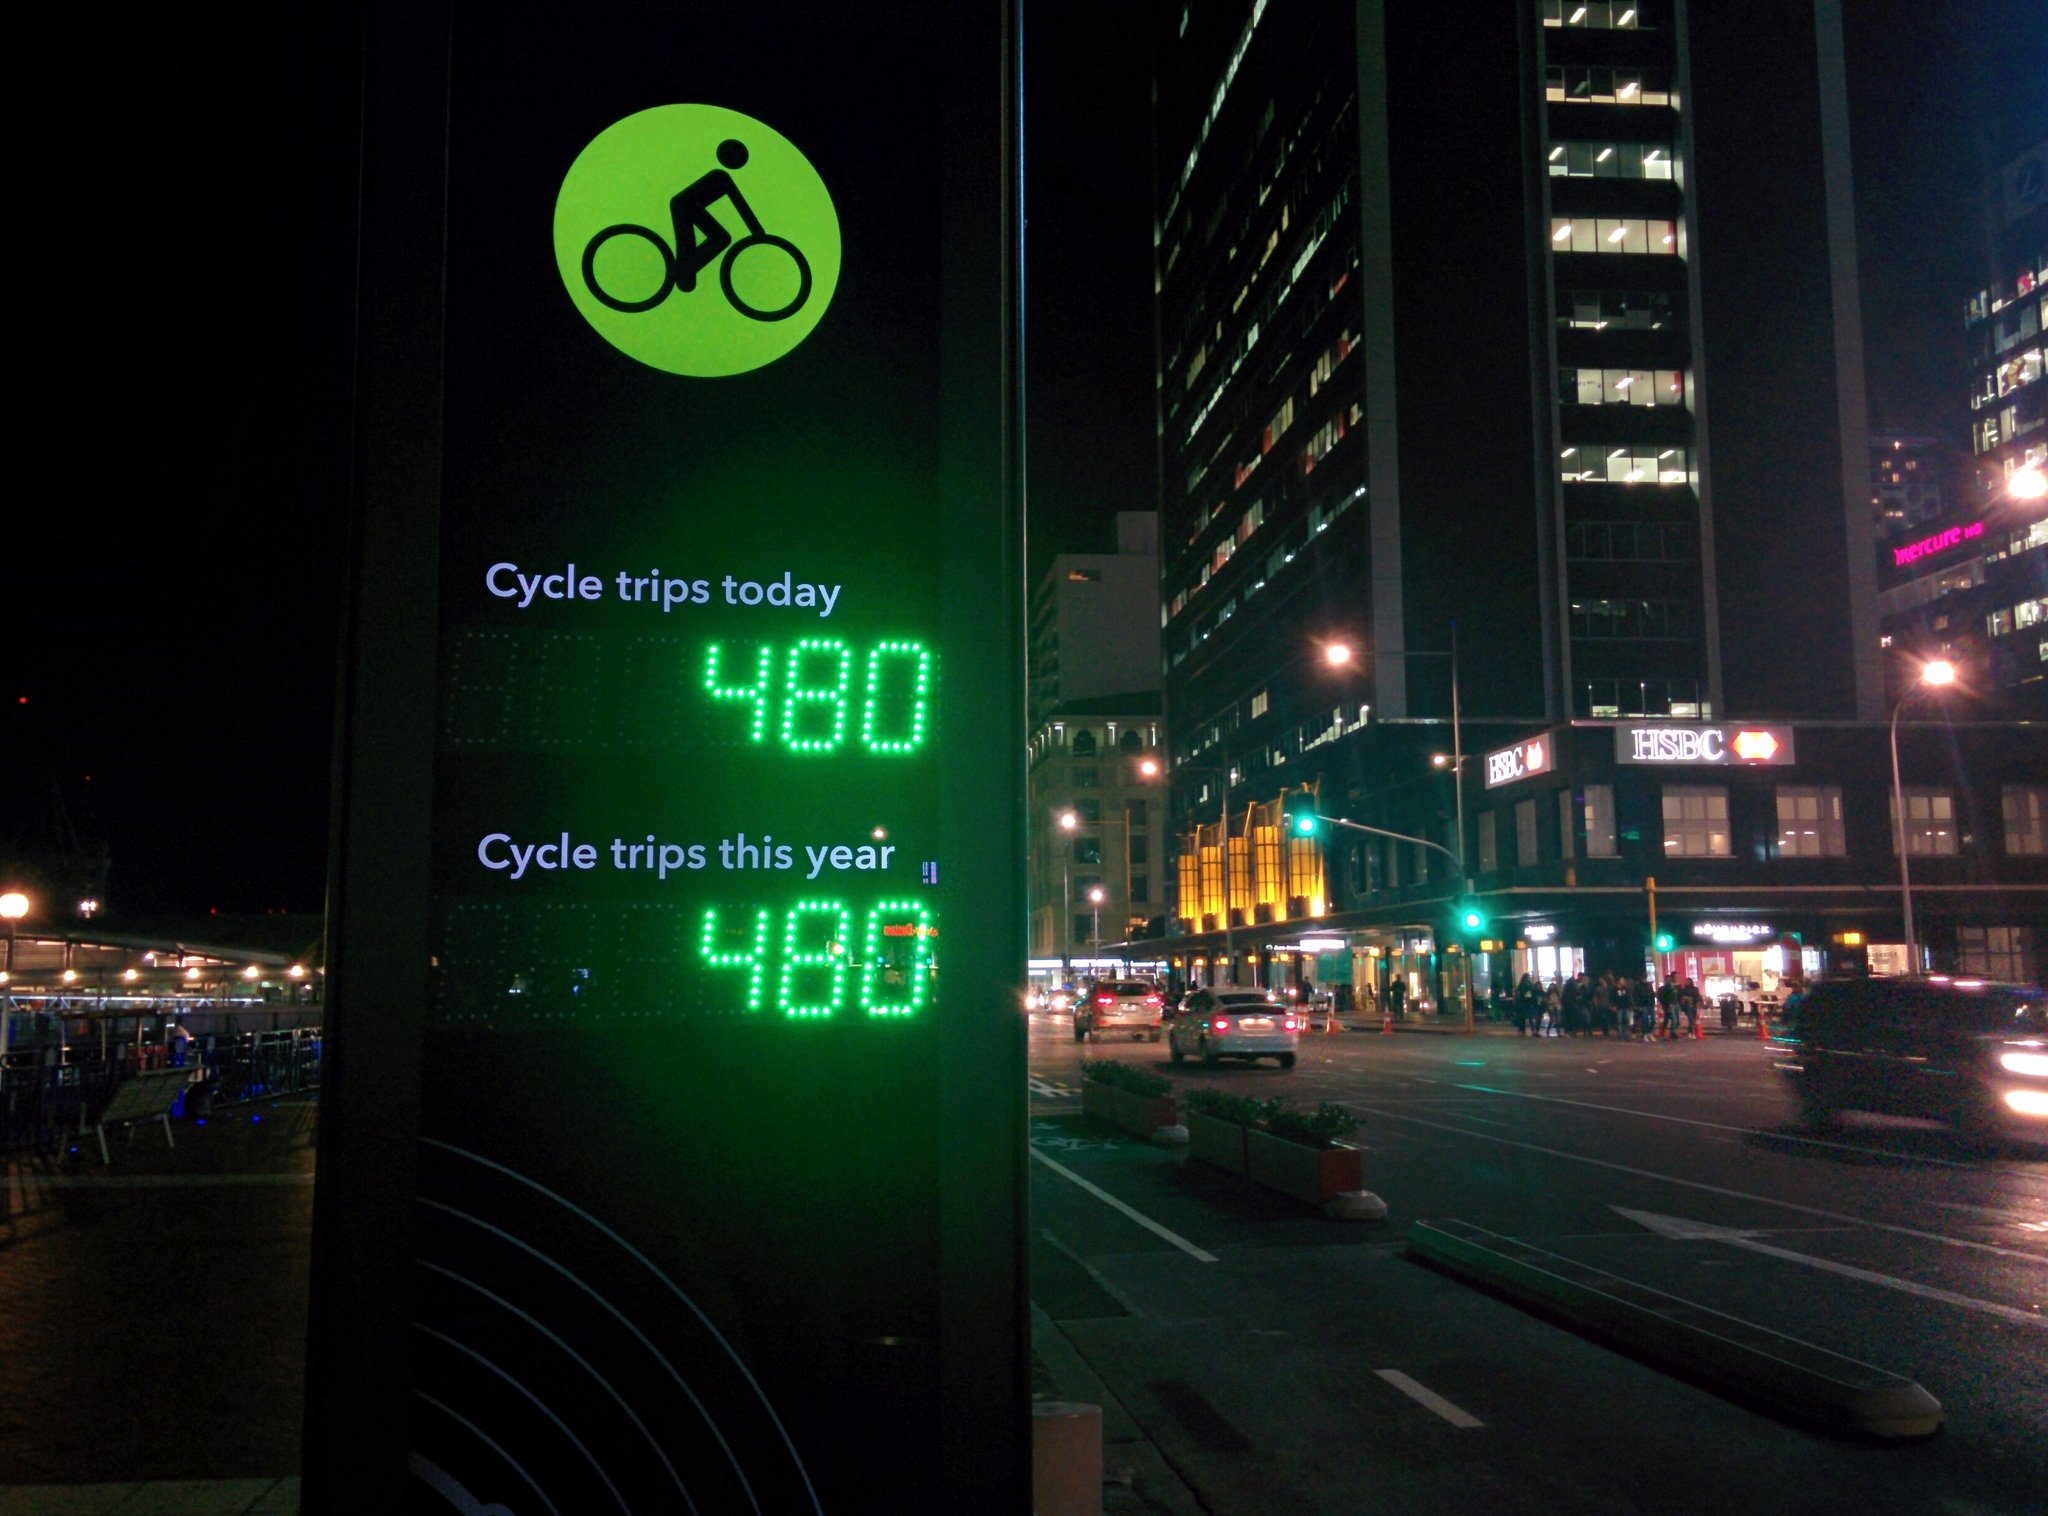
For a long while, Auckland Transport only reported trip data from 9 initial (and somewhat randomly scattered) automatic cycle counters. But over the last 2 years, AT has installed a large number of new sensors. Basically, whenever a new cycle project is opened, it now comes with a new automatic counter to measure how many people ride the new route – the flashiest of which in the future will also include public displays like the excellent ‘totem’ installed on Quay Street, with the shiny new LED display that ticks over when you bike past, and keeps a running tally of the year so far.
Together with the new counters installed around the City Centre / Inner Isthmus (i.e. the focus area of the current Urban Cycleway Programme), these will give much better, more detailed and much more up-to-date counts of Auckland bike people.
No more waiting for months and months for one single number!
AT is now also reporting the details of those counts much more openly, here. The summary data for June is not available yet – although we have the data for individual locations, as seen on the graphs below – but we do know that in May 2016, cycle numbers were up 22% on May of the year before!
If this growth continues, Auckland may well be the city in New Zealand furthest along on the way to reaching NZTA’s goal of 30% growth in urban cycling by 2018.
(Of course we’re happy to aim for even more than 30%, because we’ve still got a few decades of decline to recover from. But it’s awesome that for once, Auckland is at the head of the pack.)
In that regard, it is pleasing (if not unexpected) to see where the greatest growth is.
Surprise! It’s where new cycleways have been built… and on the routes leading to these new bikeways. This is the network effect – another way of saying ‘the whole is greater than the sum of the parts’ – and it’s really starting to kick in.
And especially on those routes, we see an interesting change – the usual winter drop-off is much shallower than usual, and in some cases hardly seems to be happening. Can it be that, with better cycleways and more company, riders are happier to keep going when it gets chilly, damp, and dark in the evenings? Is Auckland exhibiting a bit of the ‘Viking biking’ spirit of our Scandinavian antipodes?
Richard Easther, one of Bike Auckland’s associates, has done us all the lovely favour of putting those dry numbers into easy-to-grasp visuals, so we can see how and where Auckland biking is growing. Below, see some fascinating graphs of the flows at some of the counters around Auckland…
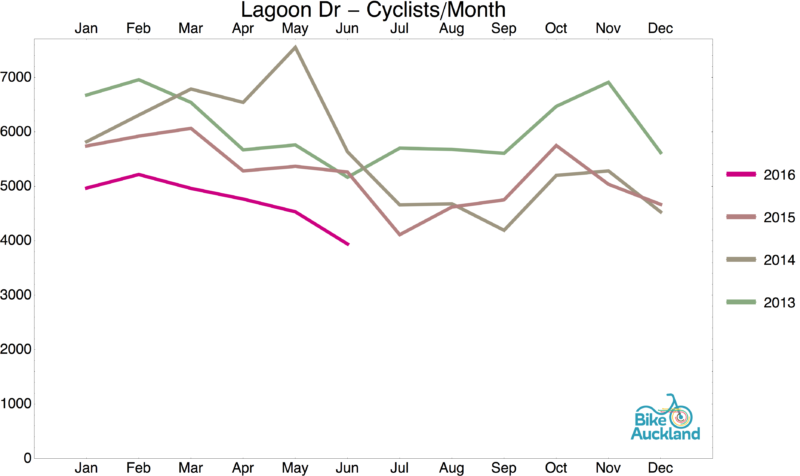
[Ed note: if you’re not a graphs or data person, two things to note: the numbers up the left hand side show the monthly total of bike trips; and you’ll notice a dip in the middle of each year as winter arrives. What’s striking about the growth on the new and newly connected paths is that not only is the annual ‘high tide’ getting higher, but the ‘low tide’ is too.]
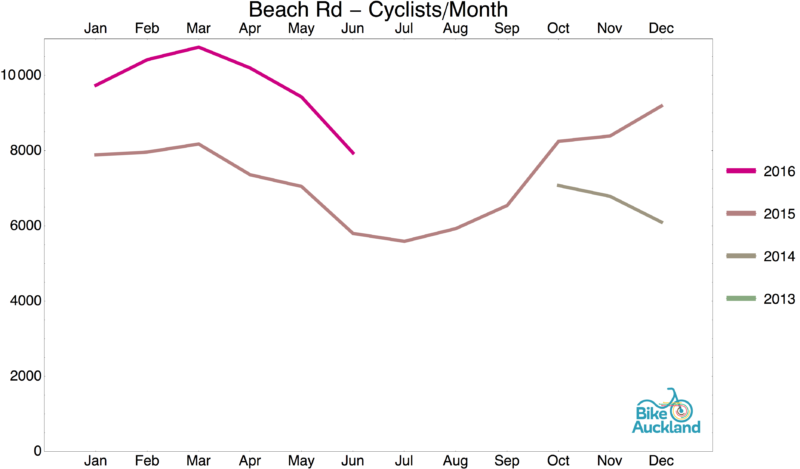
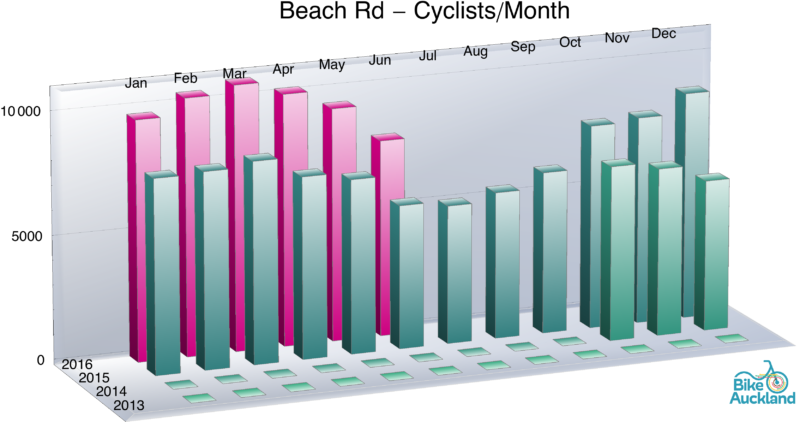
Clearly Beach Road is benefitting from all the improvements, including Grafton Gully and its own Stage II extension. A jump of around a third in many of the months earlier this year!

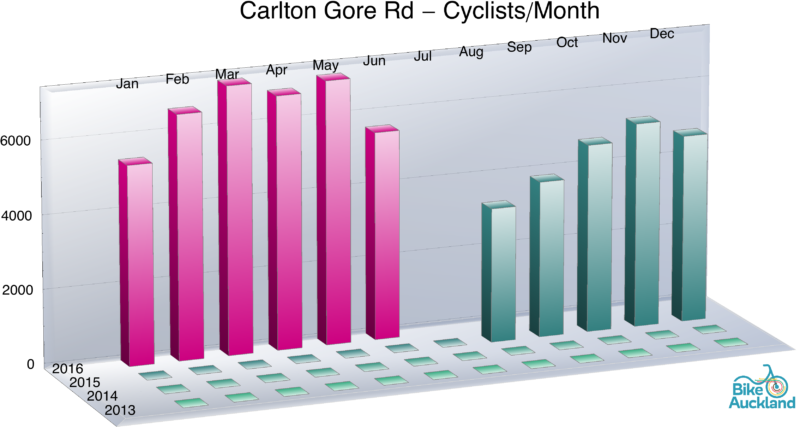
Carlton Gore only got a counter relatively late last year, but it seems clear that this key route from the east is also seeing good growth. Almost six thousand monthly users in mid-winter June!
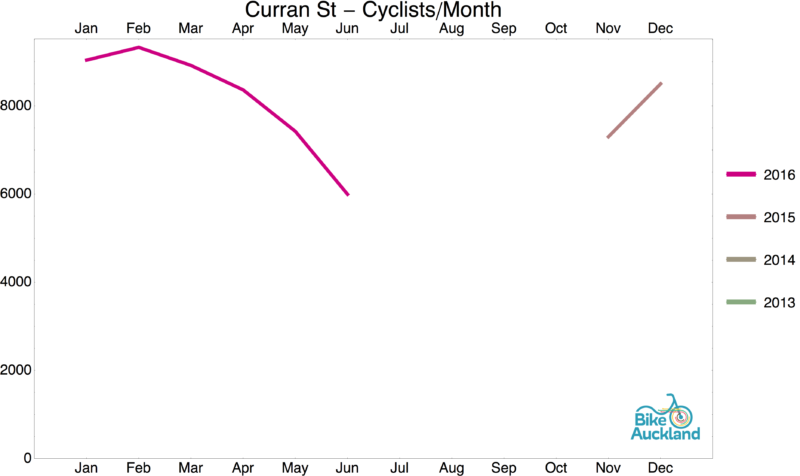
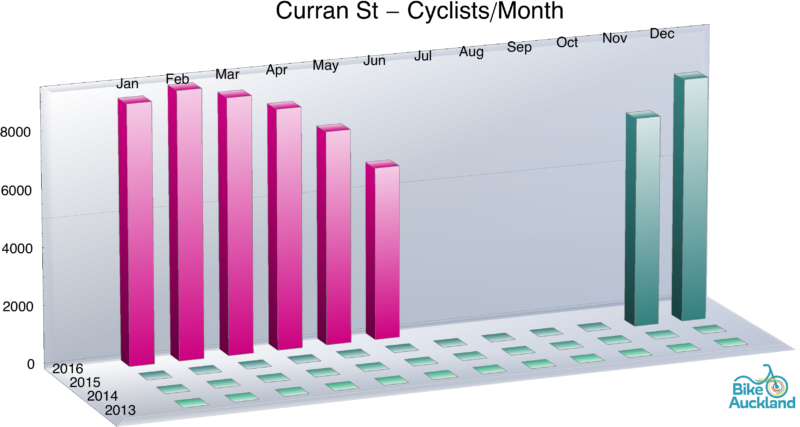
Curran Street is a key route for both recreational and transport riders from the Western suburbs into the City Centre. Of course, even though the counter is west of the Harbour Bridge, these numbers will be nothing compared to what happens once SkyPath is built…
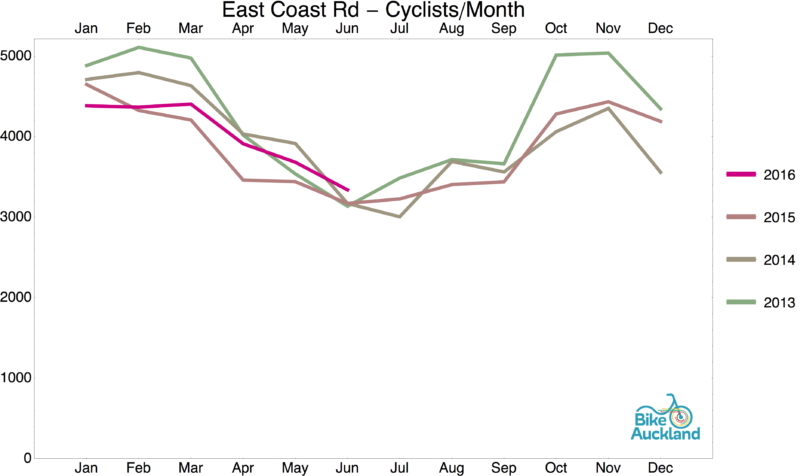
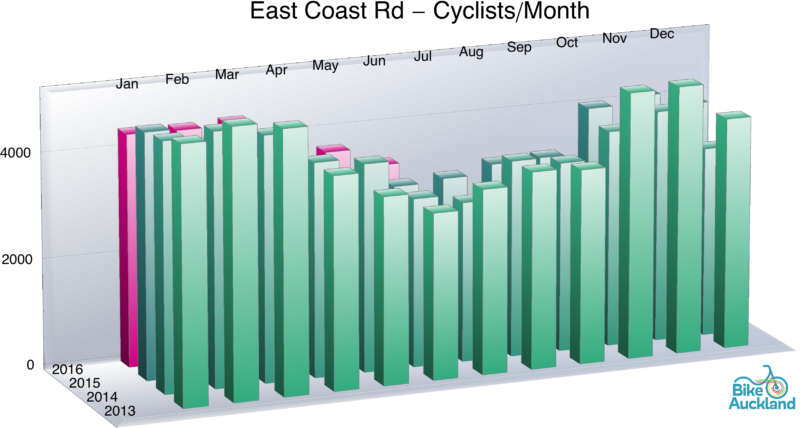
Numbers on East Coast Road near Constellation Drive have been static – not surprising, as little cycle investment has occurred in the area in recent years.
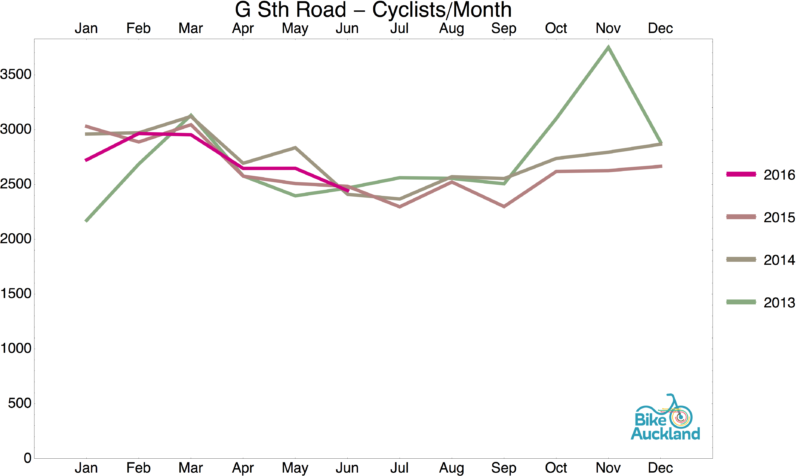
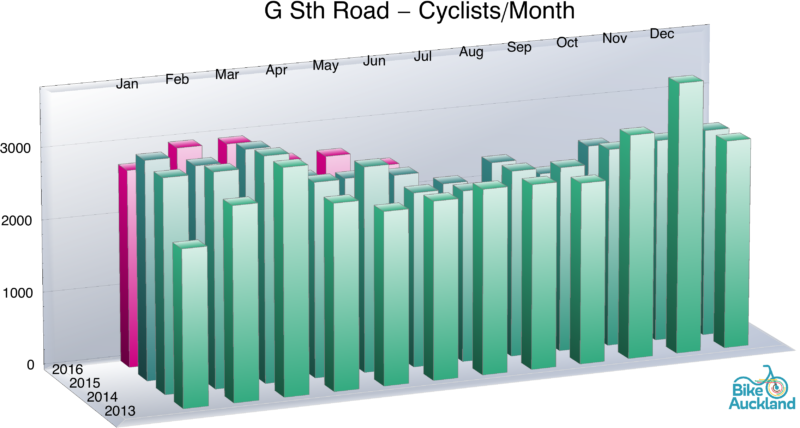
Likewise, nothing very exciting to see at Great South Road near Cavendish Drive.
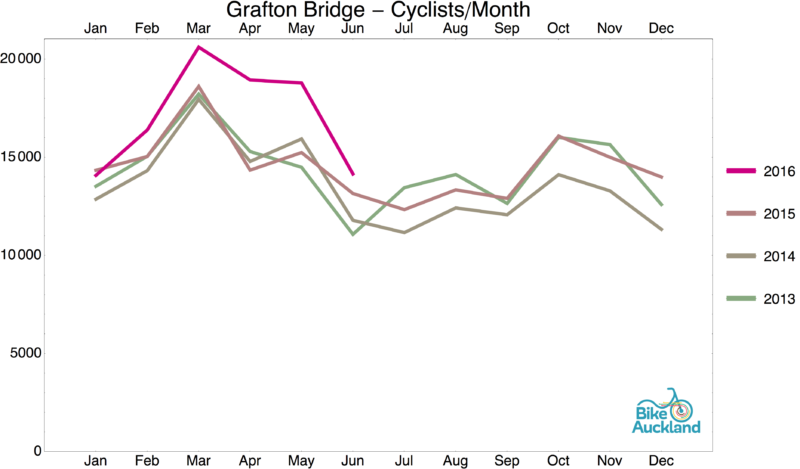
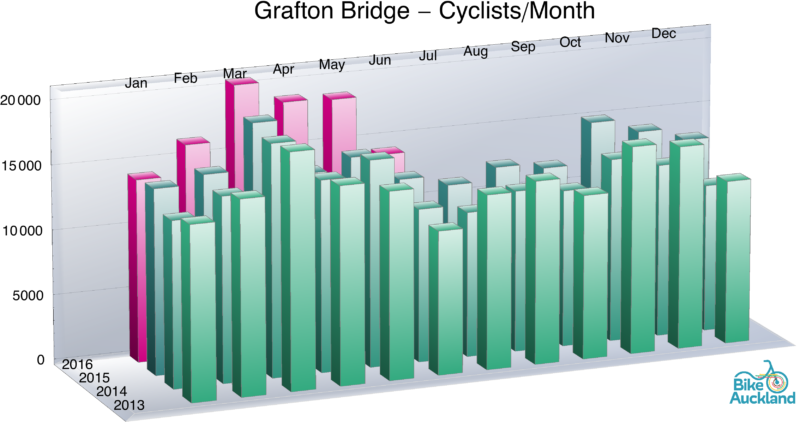
While not as spectacular as the Northwestern Cycleway (see further down), Grafton Bridge seems to be getting a nice little boost from the city improvements. And the cycle numbers are very respectable for a route that riders have to share with lots of intimidating buses…
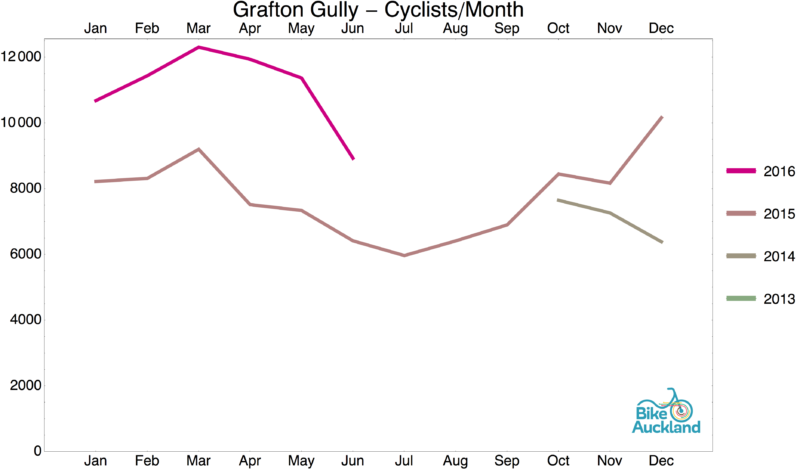

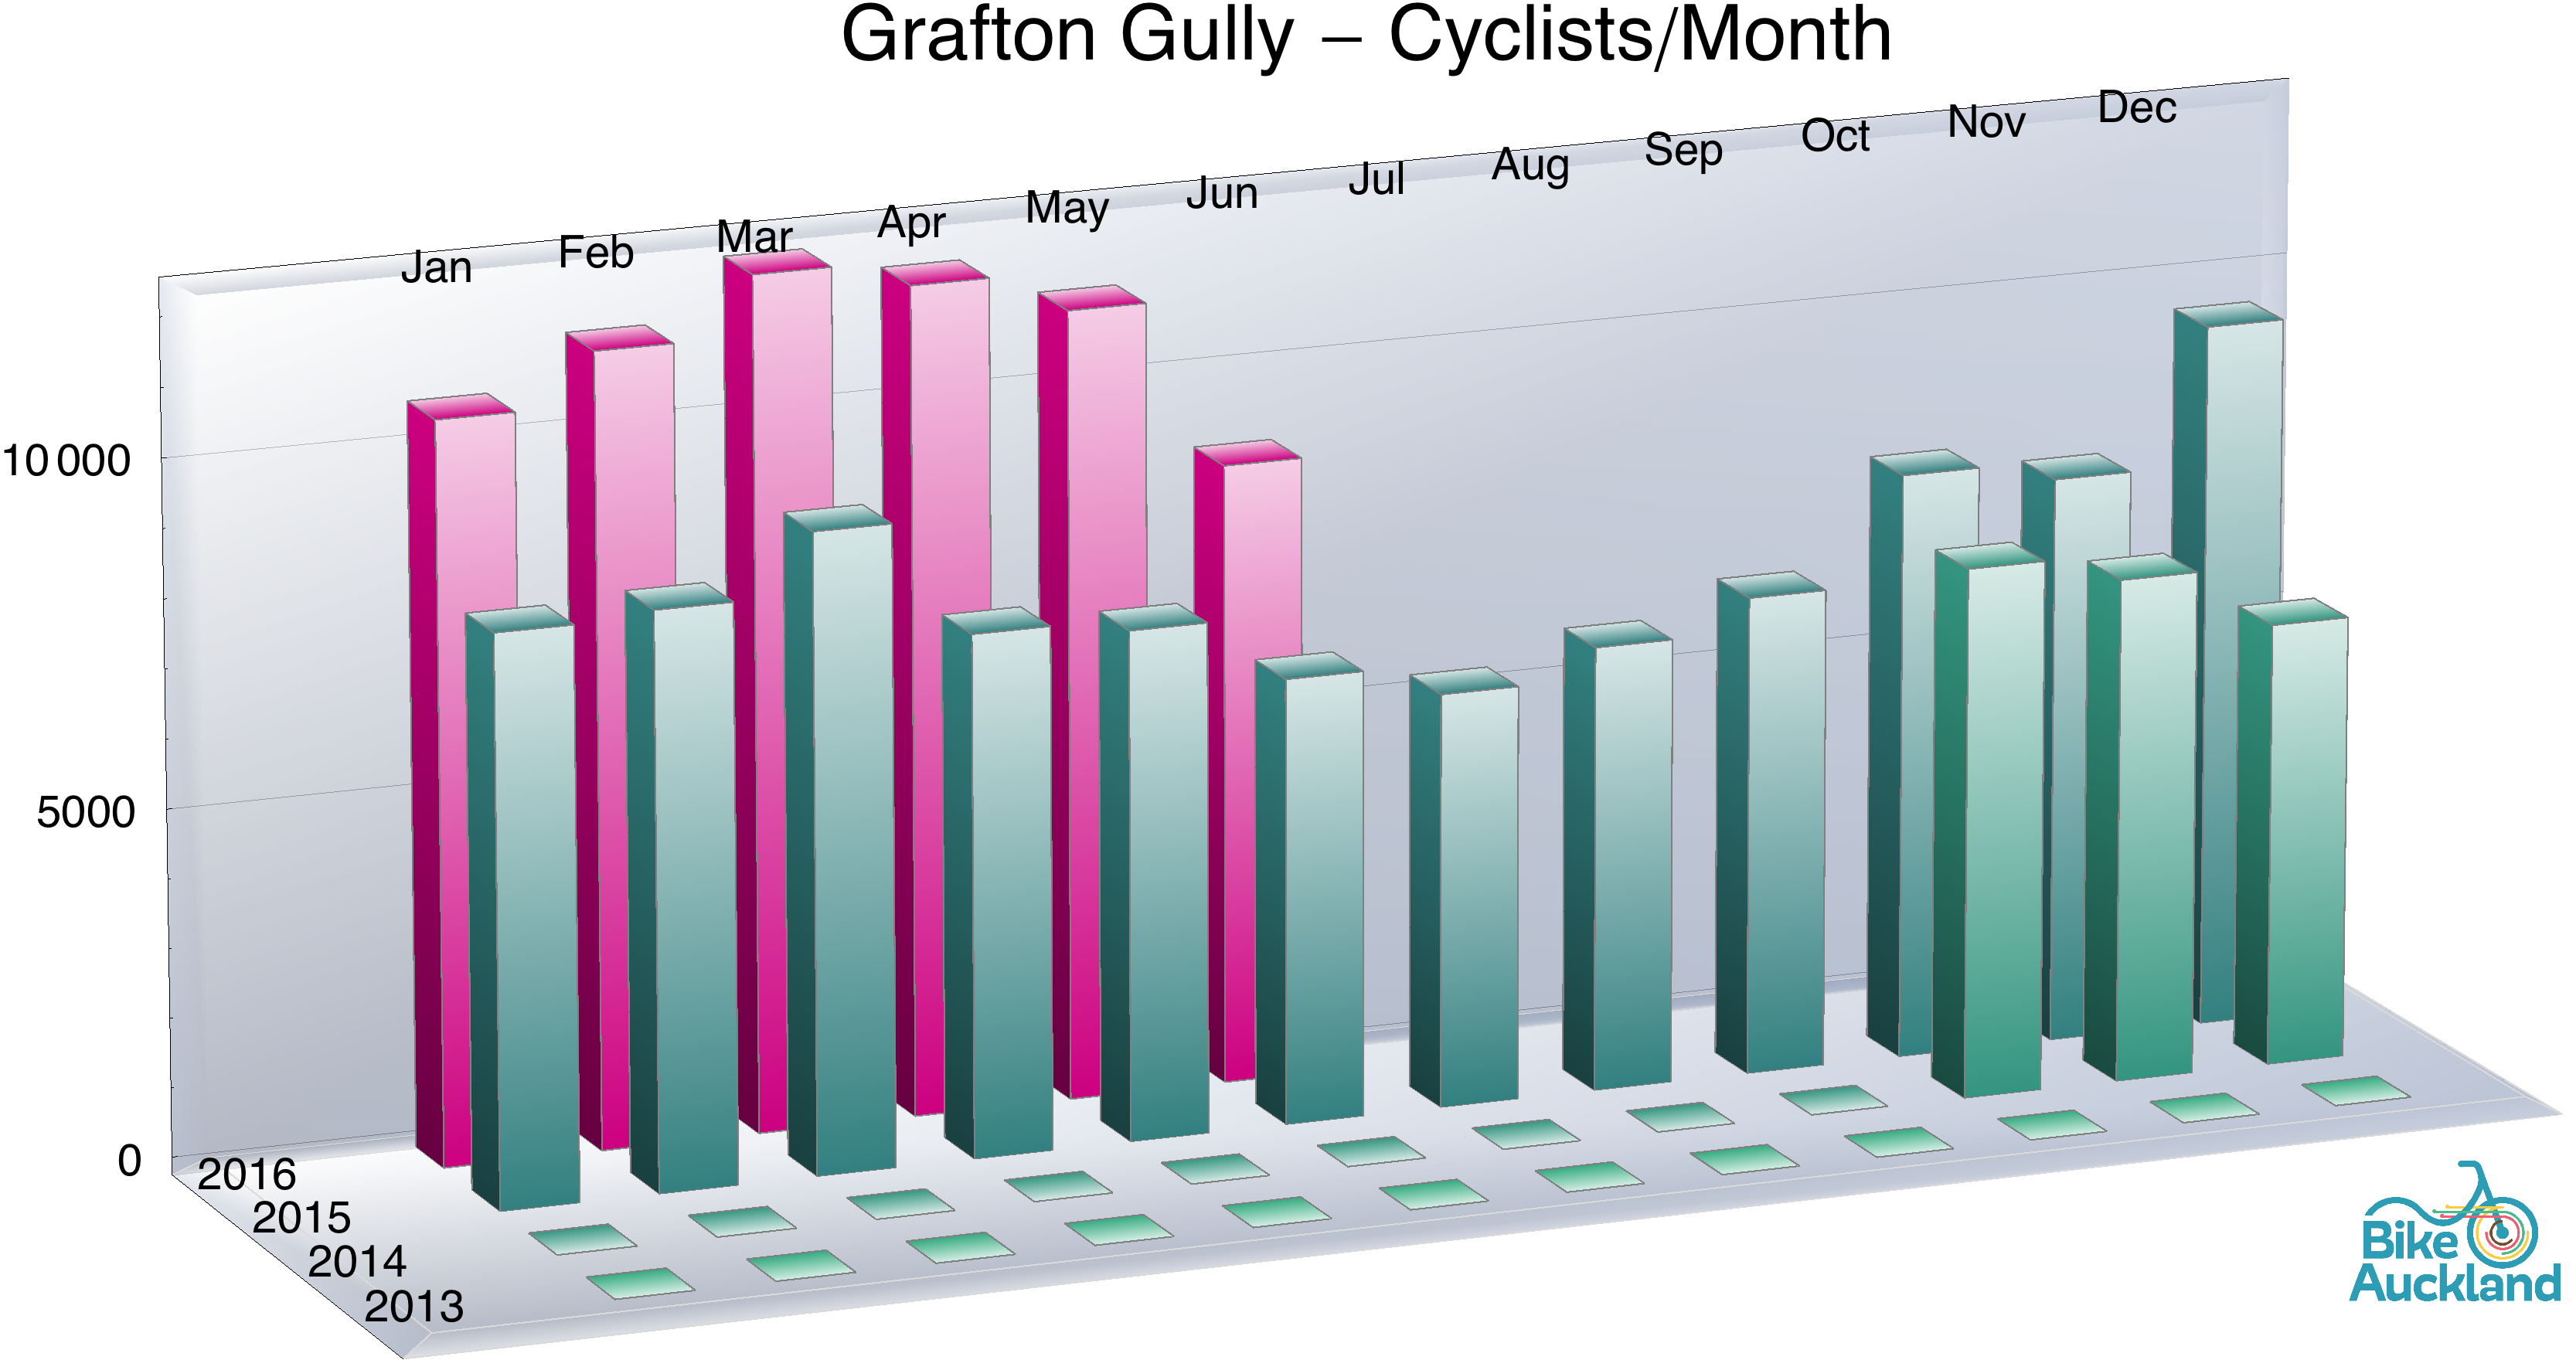
Grafton Gully, far from declining after getting ‘competition’ from Lightpath on the other side of the City Centre, is roaring ahead.
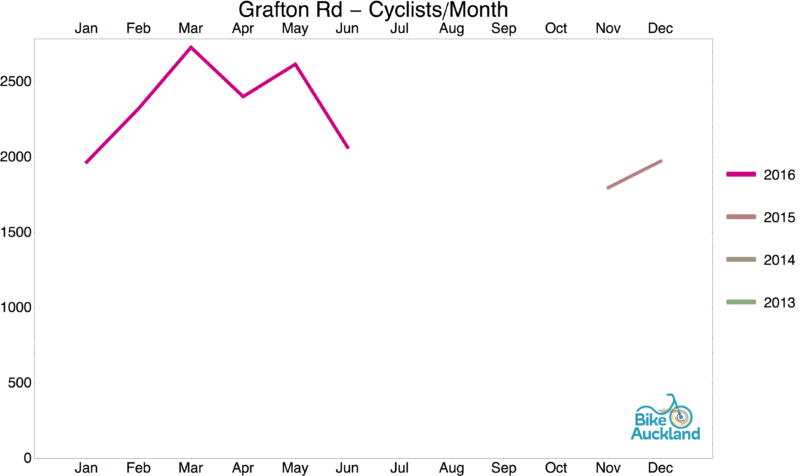
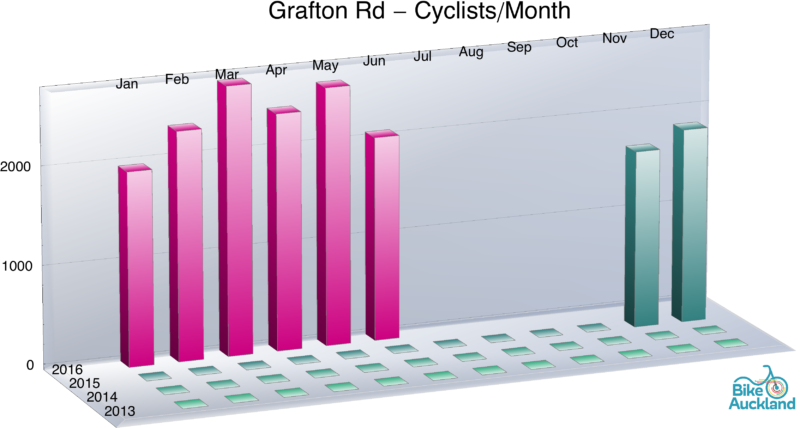
While not yet a really busy route, Grafton Road, which brings riders towards the university area from the east, may already be showing some growth, seeing data from the early part of the year. Time will tell, once comparative data for a year or more exists.
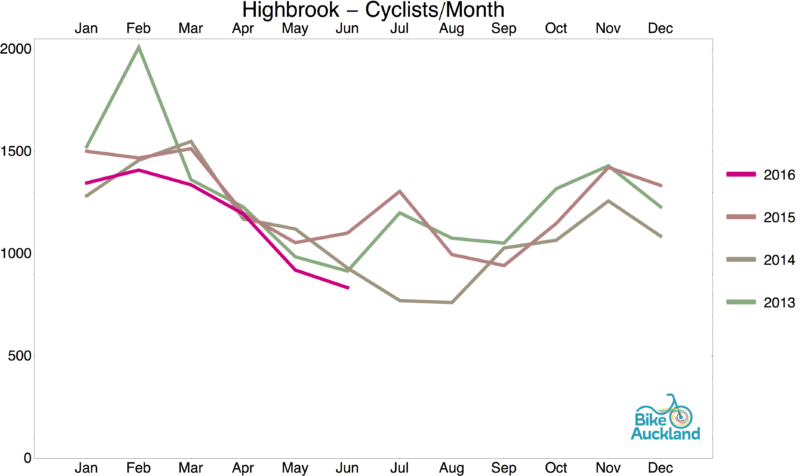
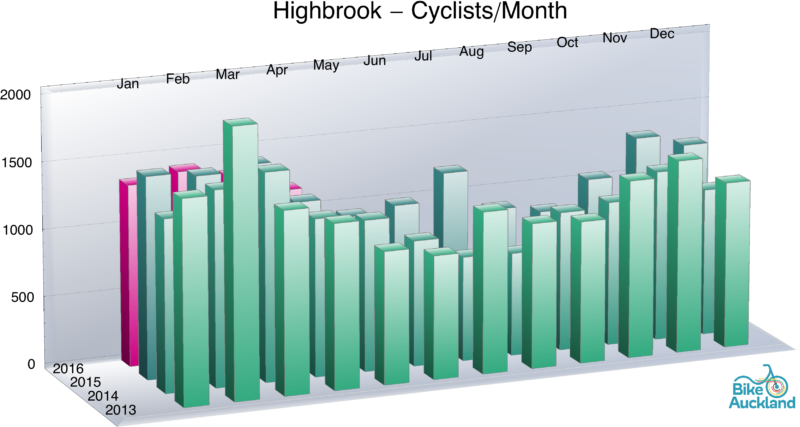
Another southern counter, Highbrook is seeing little change and little use – which is not surprising for a short isolated path in the middle of a lot of nothing (cycling infrastructure-wise) each side.
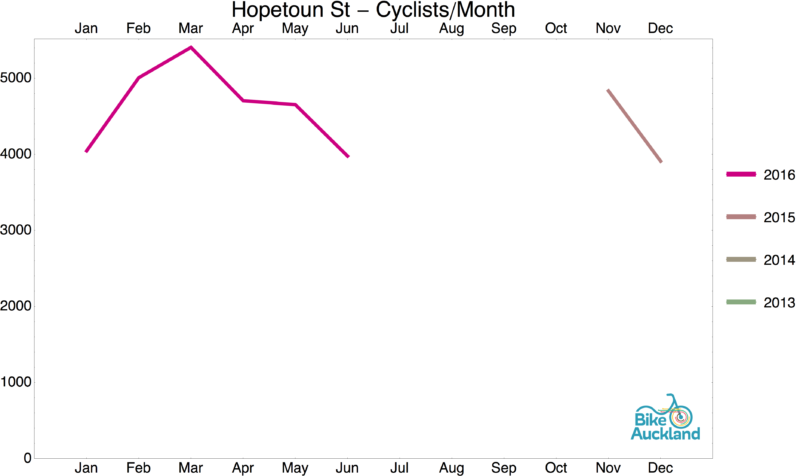

A new counter, Hopetoun St is another addition to the ‘cordon’, to ensure all riders in and out of the City Centre are properly accounted for – these ones arriving from Ponsonby and probably Grey Lynn. No real trend visible here yet, but definite evidence of life, with a hundred or so bike trips a day across this handy but narrow bridge with no bike infrastructure.

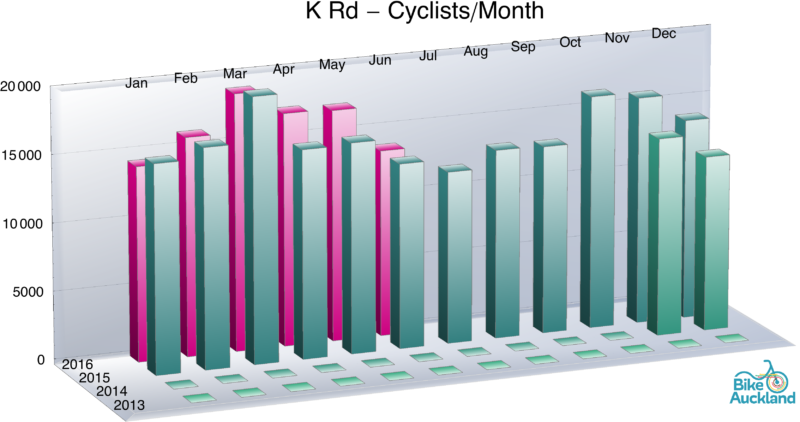
On Karangahape Road, some tentative growth is visible, but the real boom hasn’t started yet. Still, the base numbers are some of the highest of all the counters – and everyone is waiting for the Great North Road and K Road cycle lanes, which we think will make these numbers take off like a rocket!
Poor Panmure-Pakuranga, declining despite being such an important link! The AMETI cycleways as part of the busway project have been promised for years and years (and have been held up by the lack of public transport funding in this still car-focussed country of ours…), but so far, all that’s been built was a new tunnel road north-south and 100m of busway. Bring on the new bike paths!
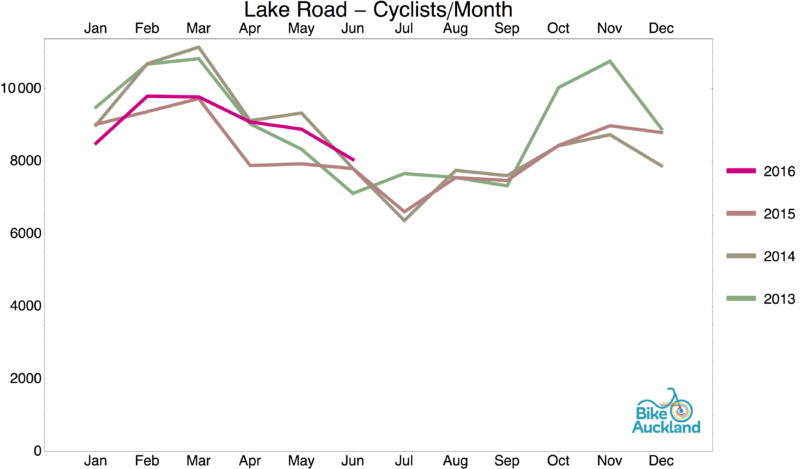
Lake Road counts are steady, but not exactly fascinating. Lots of regular riders, but few new converts, it seems…
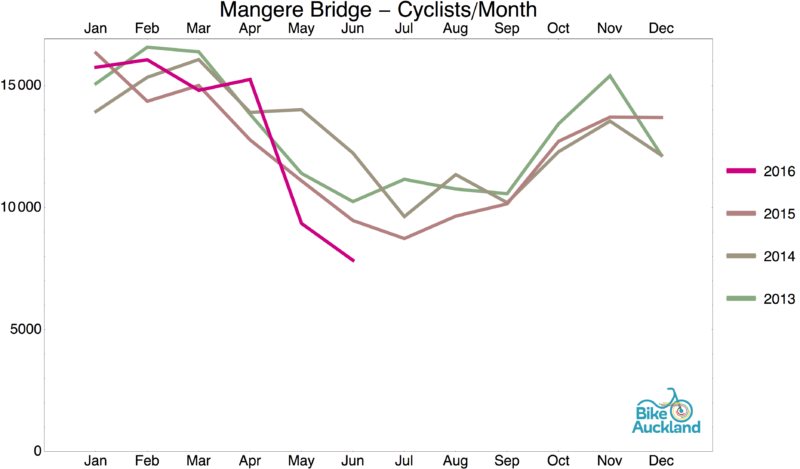
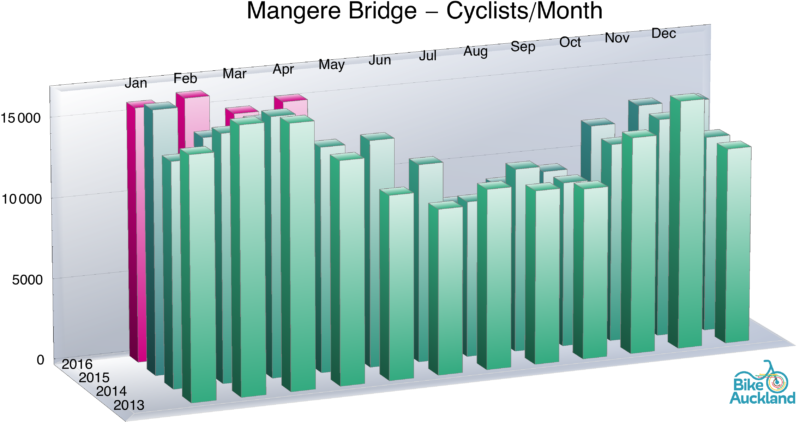
A similar situation for Mangere Bridge. It’s an important connection and the demand is there and steady, but not exactly showing spectacular growth.
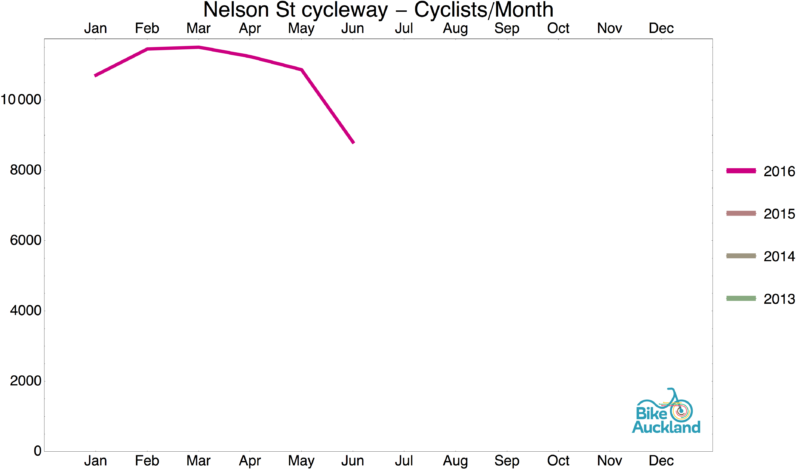
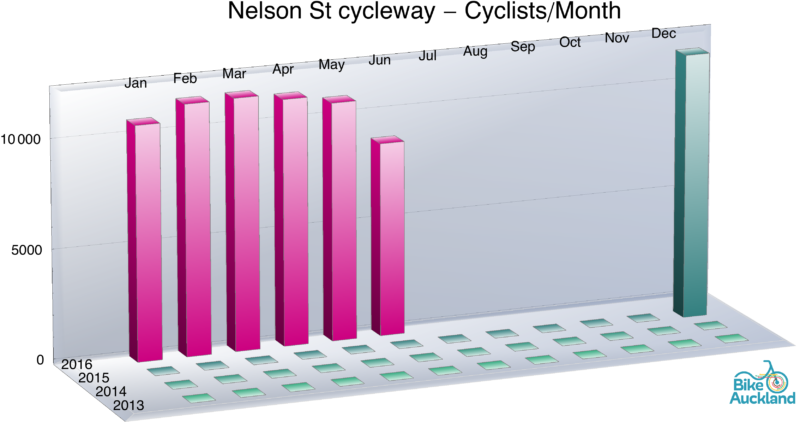
Nelson Street (i.e. through the City itself, not Lightpath) is showing very heavy numbers. The REAL growth here is not visible in the stats: after all, before the protected cycleway opened, this route had just some 5-10 incredibly brave cyclists every morning… now there are several hundred daily, even though the route is still truncated and stops at Victoria St.
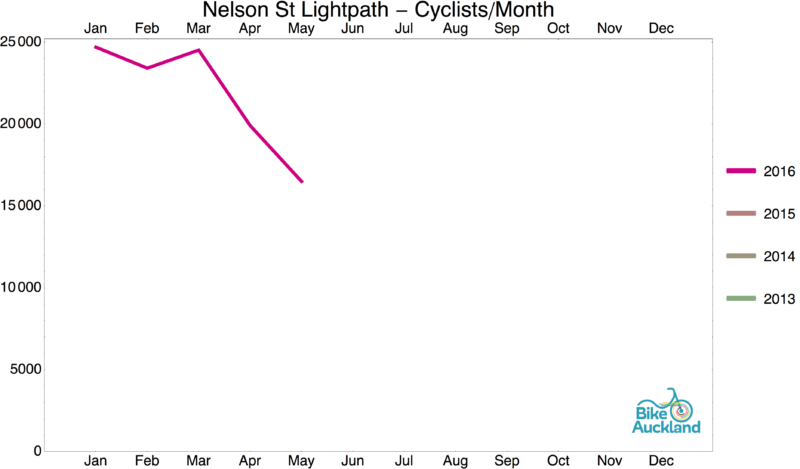
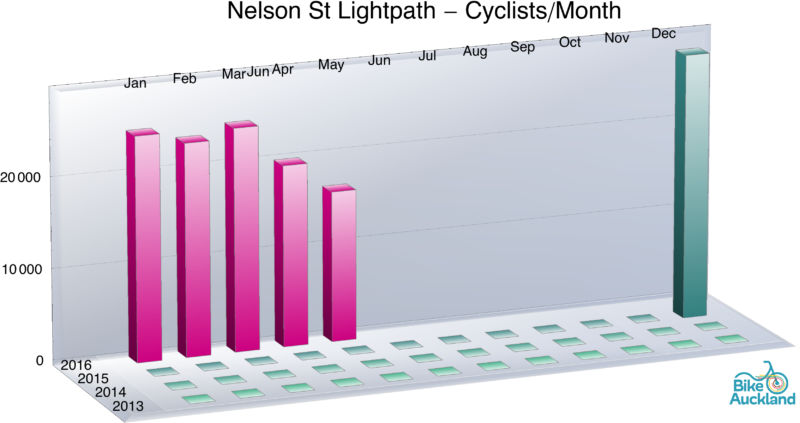
Compared to the ‘road part’ of the Nelson Street Cycleway, Lightpath of course gets the glamour boost – even having settled down from its huge early months over summer, it’s still racking up almost twice the numbers as one kilometre further north (no surprise there; as an entirely car-free space, and a magical location of its own, it’s much more welcoming to kids and new riders). Now for getting all those recreational riders onto a bike for other trips…

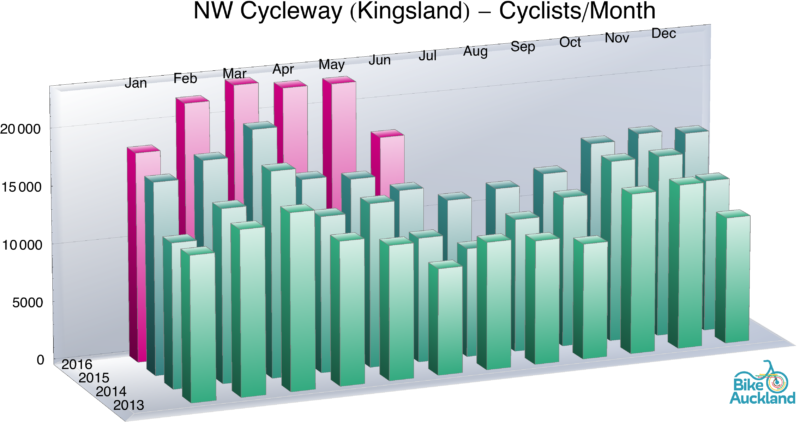
Here’s where the network effect rubber really hits the road, er, off-road cycleway. You can see how the magnetic field of the pink path boom (and the related Grafton Gully effect) has spread far and wide – even more than 5km away, in Kingsland, where numbers are massively up on 2014 and 2015.
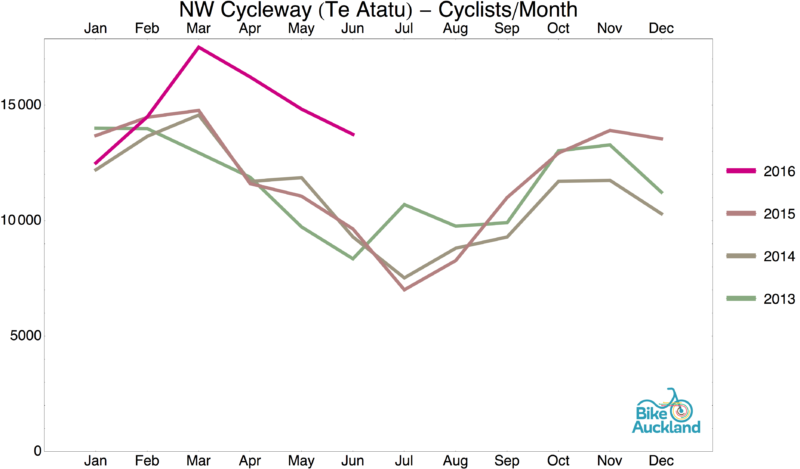
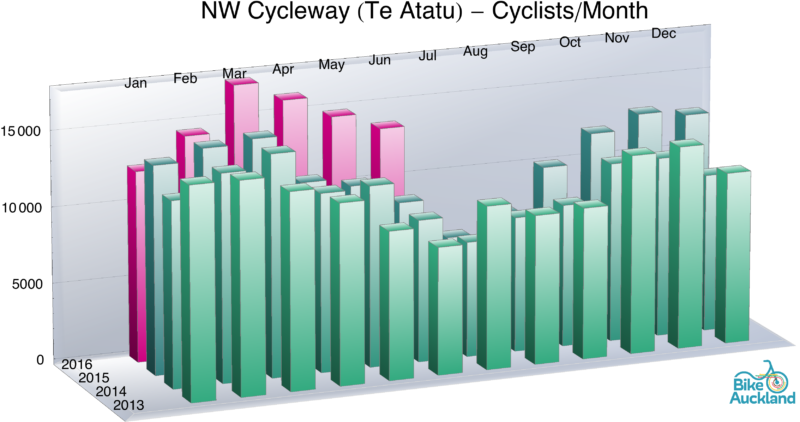
And the effect continues at Te Atatu over 10 km away; if the numbers traveling to the city from further out are a bit lower, they’re still really really high (and resisting the usual winter drop-off). Recent cycleway improvements along the causeway will definitely have helped with this.
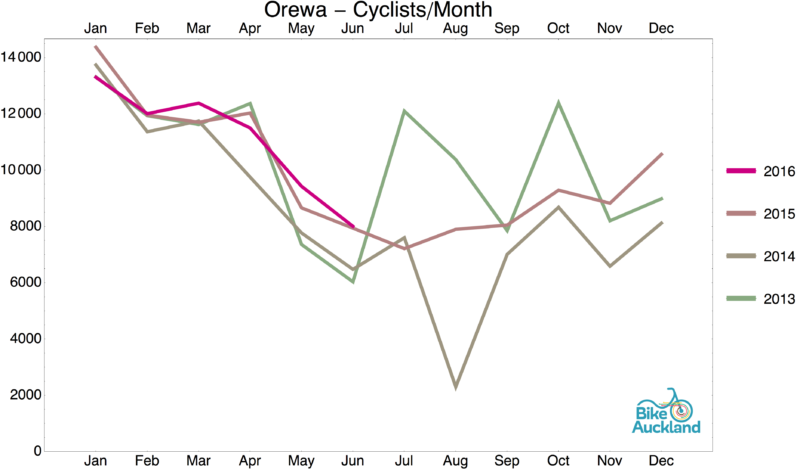
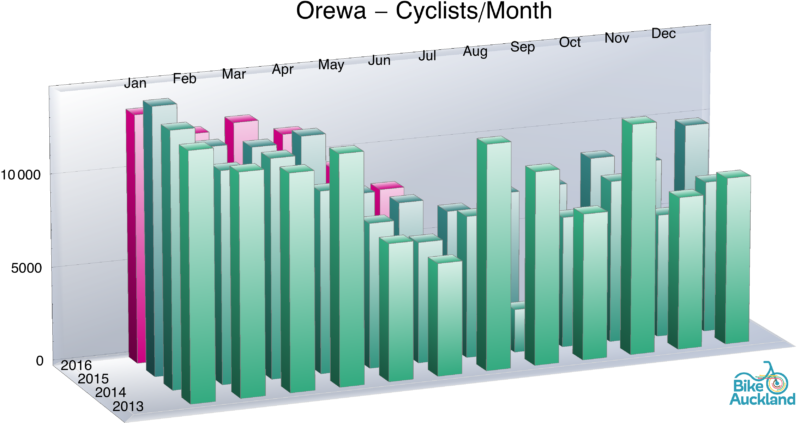
The popular Orewa Path, sadly, is static, albeit at a relatively high level. More bike funding for areas of Auckland beyond the current central city focus will be needed before this can take off again.
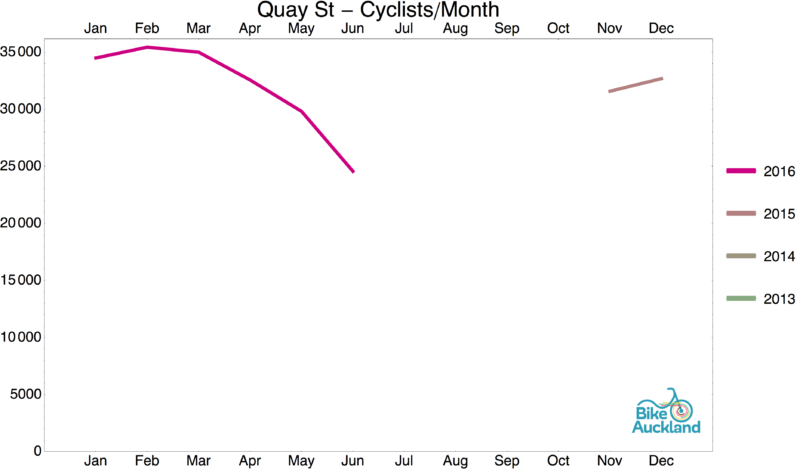

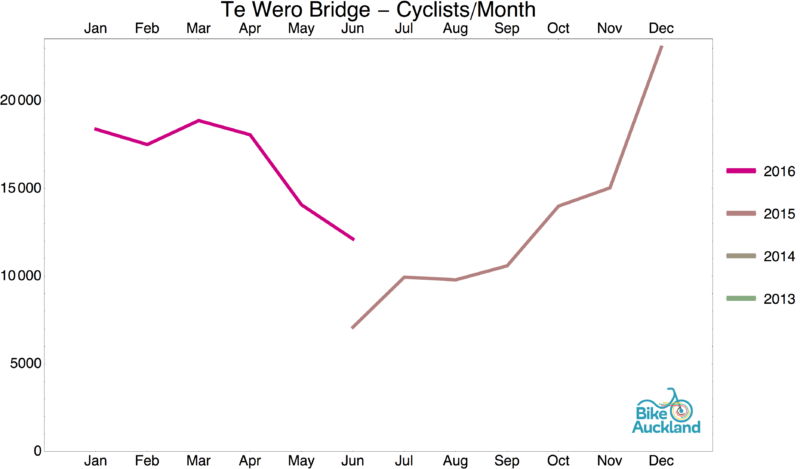
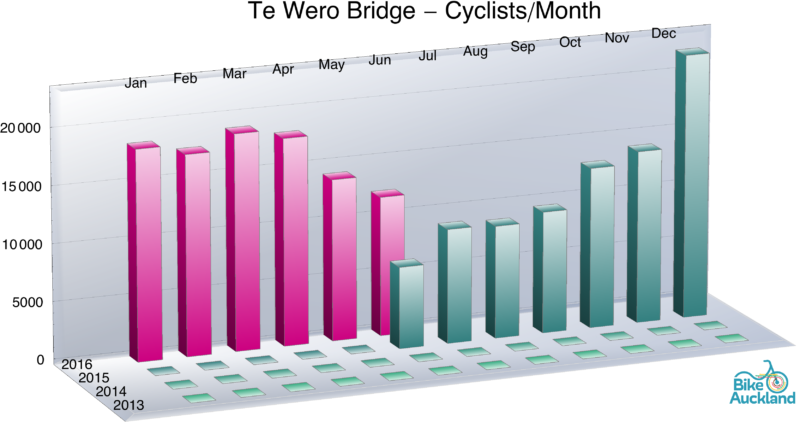
This Quay St data is from the counter installed before the actual cycleway was opened, so we will be fascinated to see the impact of QuayPath.
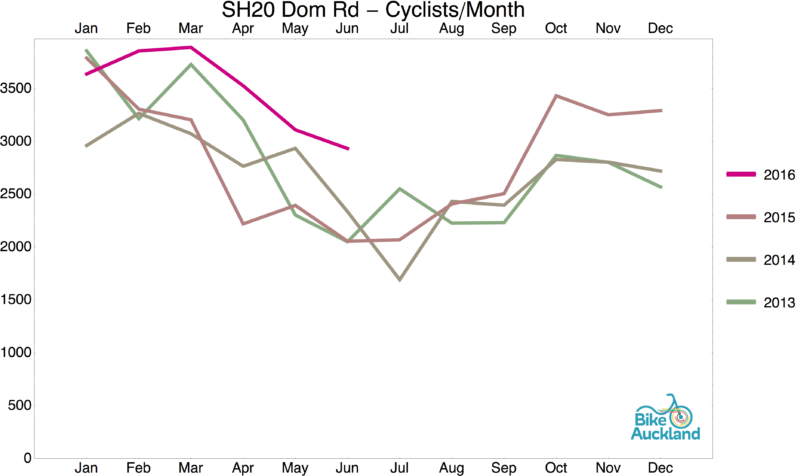
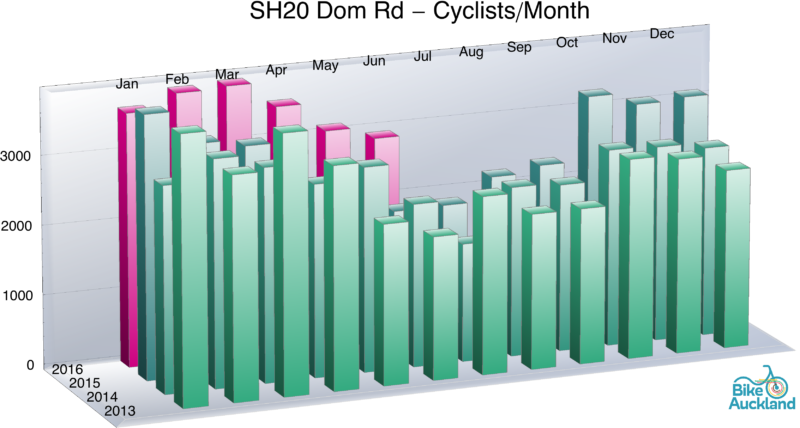
Another location without massive change yet, although the 2016 numbers have definitely popped up. It will be interesting to see whether the opening of Waterview Shared Path next year will bring more substantial growth, despite it being a long way around if you are in the Dominion Road area…
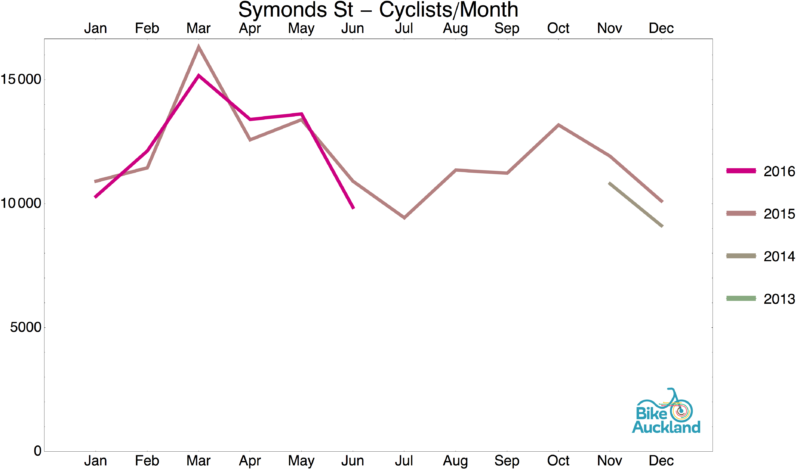
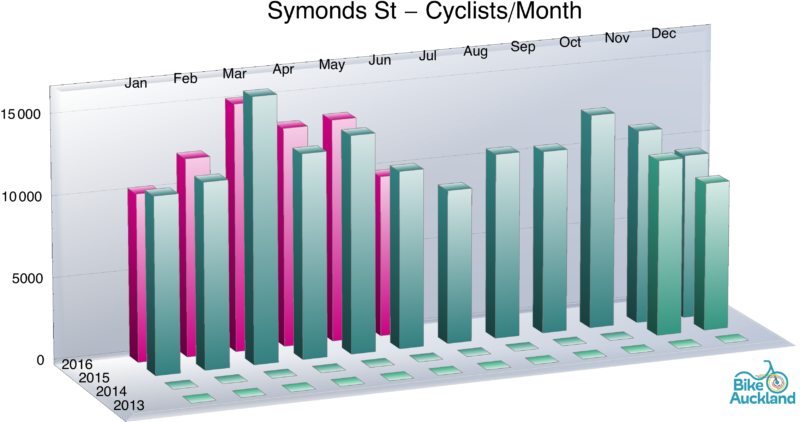
One of the worries among some was that Grafton Gully would ‘cannibalise’ riding on Symonds Street (an important route to the universities and into town). It does not seem to have done so – or more likely, some people will have been drawn off onto the quieter parallel route, while others will have been added as part of the rider growth in the area.
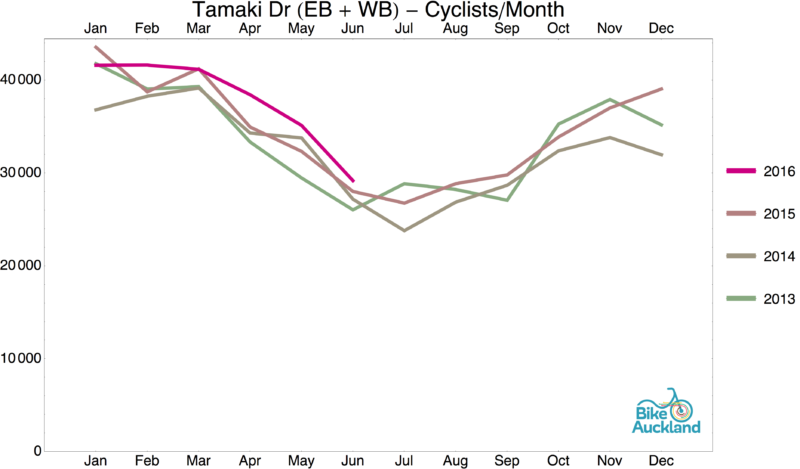
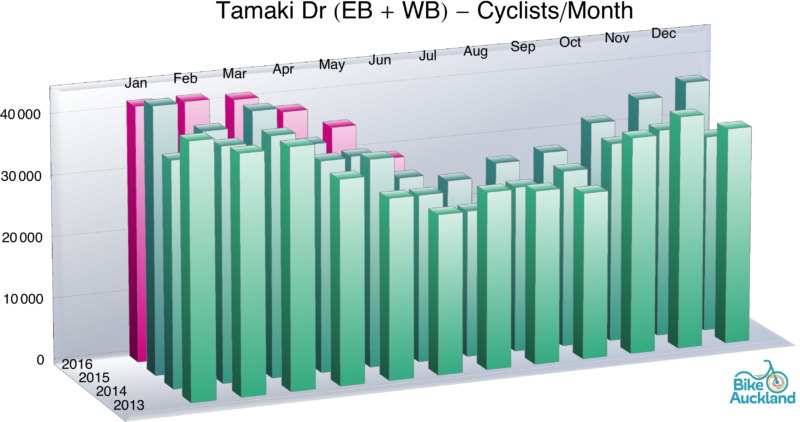
We see a slight boost on Tamaki Drive – but the real growth will come from Quay Street (now open), Quay Street to Ngapipi (~2017-2018) and Glen Innes-Tamaki (2018). Until then, though, our busiest cycle route continues to pedal along in huge numbers.
Another ‘keeping track’ counter for the City Centre cordon – you can see how busy cycling along the waterfront already is. Expect more with QuayPath, and possibly with new Wynyard Quarter / Viaduct Basin routes to come next year.
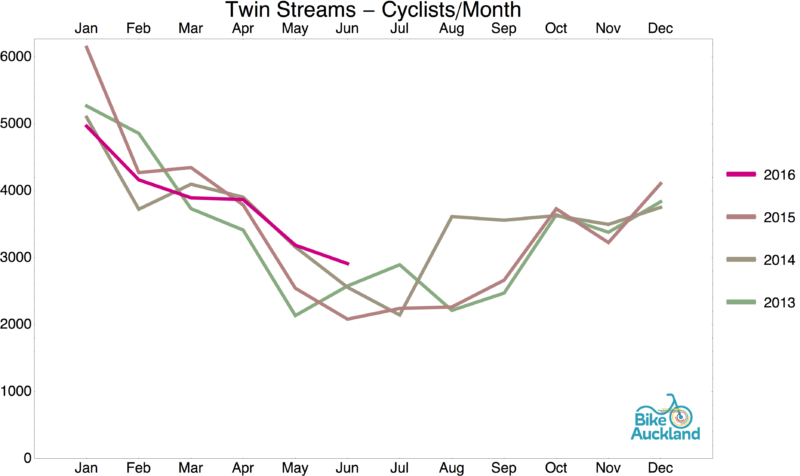
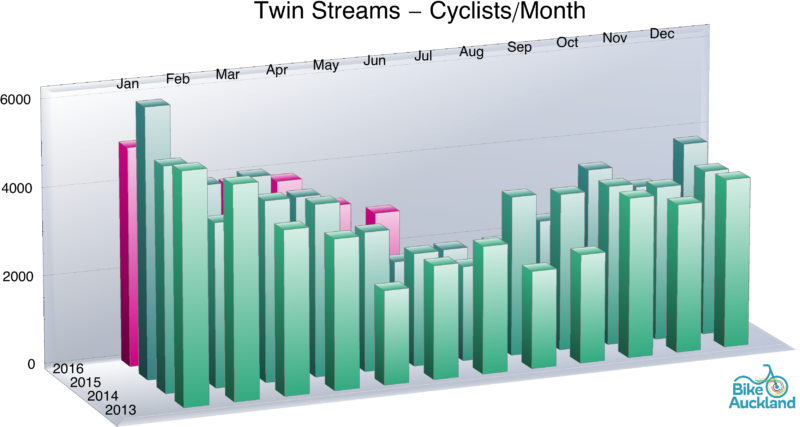
Steady, but not spectacular (note: the Twin Streams counter is southwest of Henderson, so somewhat more recreationally-focussed than other paths, and probably unlikely to capture a boom here from the new connection to the NW cycleway).
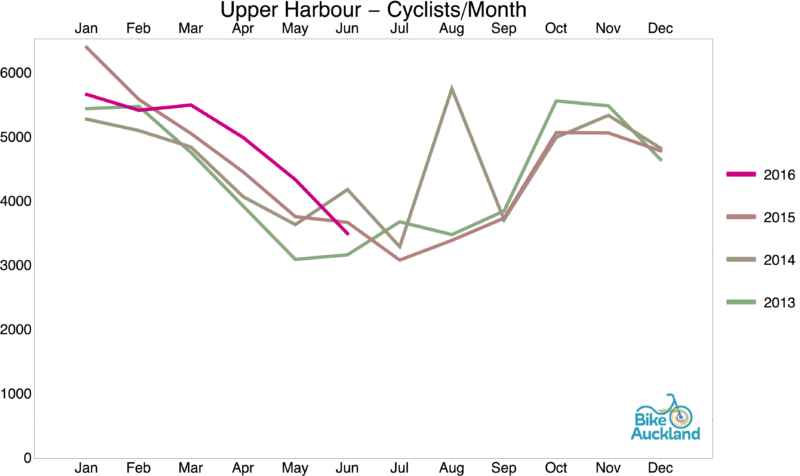
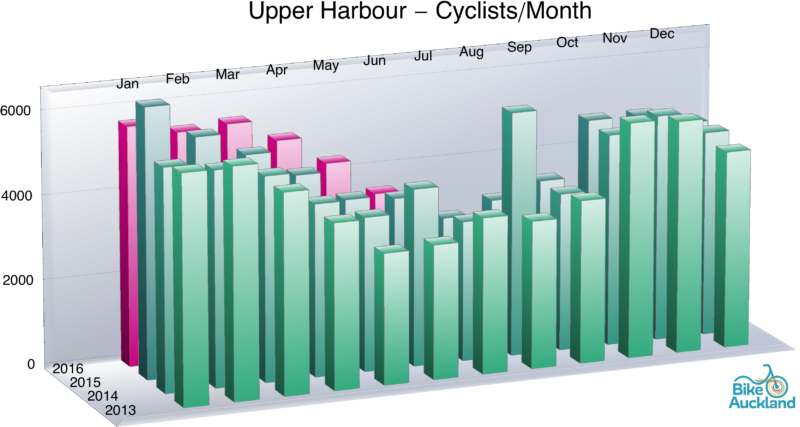
The new painted cycle lanes on Upper Harbour Drive seem to have created a slight boost, but overall, there is little change on this longer-distance west-east route on the Shore.
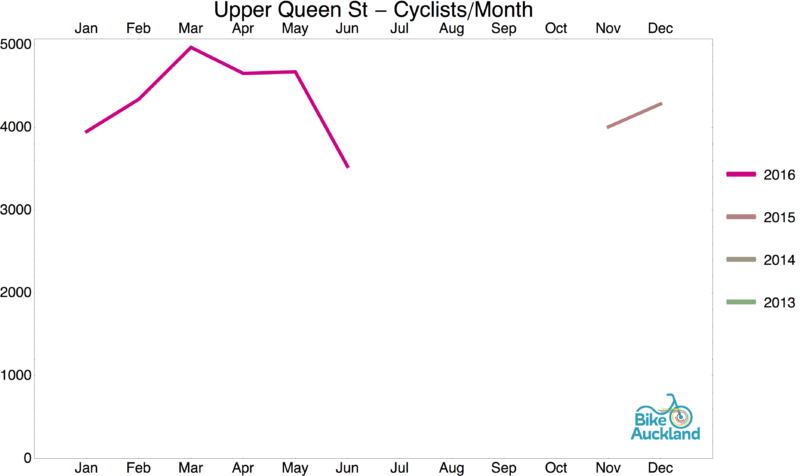
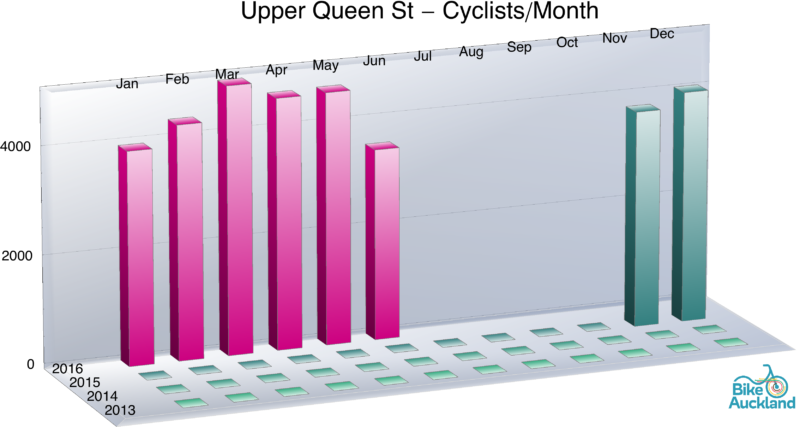
Upper Queen Street is another ‘keeping track’ counter, to identify how bikes are entering the central city. From the low numbers, we suspect that this is actually between the Upper Queen Street Bridge and K Road, thus missing all the riders who head into the city along Grafton Gully or Lightpath.


We were recently shown plans for the Victoria St West cycleway designs – we cant share them yet, but let’s just say that with them and the agreed Franklin Road cycle lanes, we expect this currently somewhat humdrum but absolutely key route to take off in the coming years too.