
 We haven’t run a blog on cycle numbers reported at the automatic counters for a while – partly this was because for 2 our of the last 3 months, it was ridiculously difficult to get the numbers (the reported public website to access the counters is still MIA, and even the AT Board reports were missing the relevant data several times running).
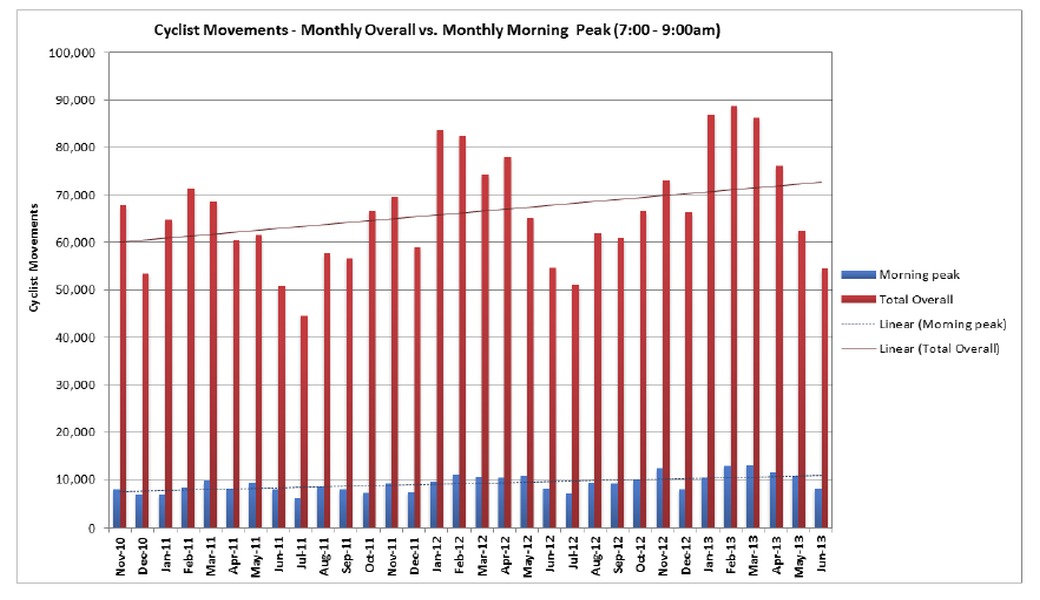
Now we finally have the numbers again and the data (Page 23), while far from depressing, is not quite as good anymore as in some recent months. Basically, we had reductions in cycle numbers over the last 3 months running, compared to the same 3 months a year ago.
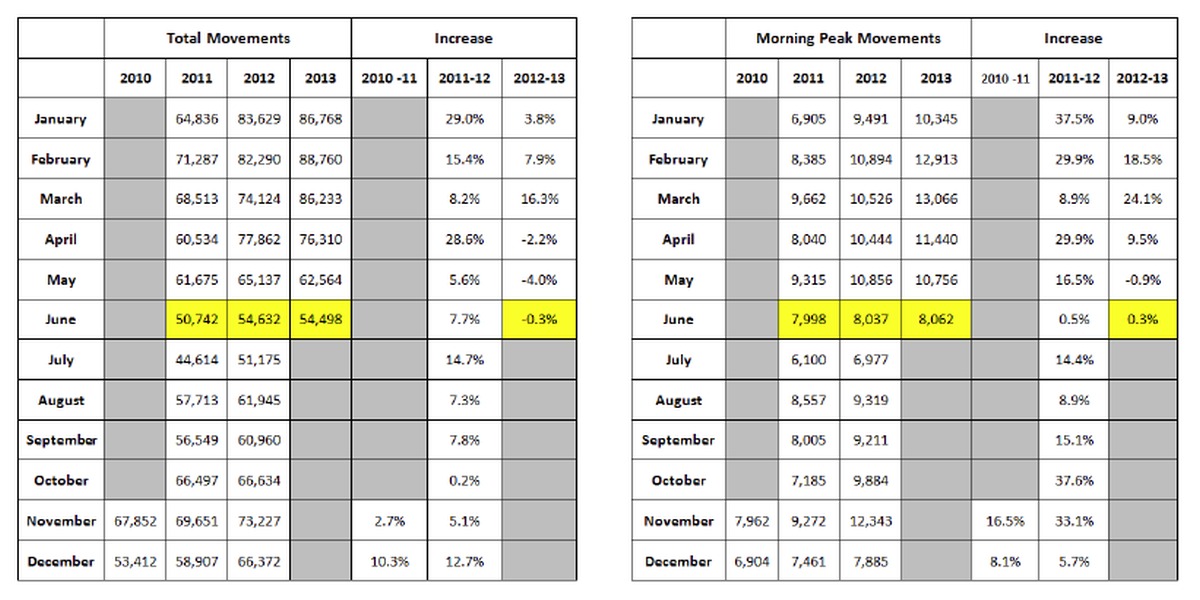 The bad news is that April saw a 2.2% reduction, May a 4.0% reduction, and June a 0.3% reduction.
The good news is that comparing the last 12 months with the last 12 months before that, we are still 5.5% up, year-on-year at the 9 automatic counter sites that Auckland Transport manages around Auckland (mostly on shared paths).
So no reason to worry too much yet – as early as this March, we had a bumper month 16.3% higher than the March the year before. Some time later this winter, we should also get data from this year’s Census, and the latest Auckland-wide manual cycling survey, to give us further data points on the wider trends.


