
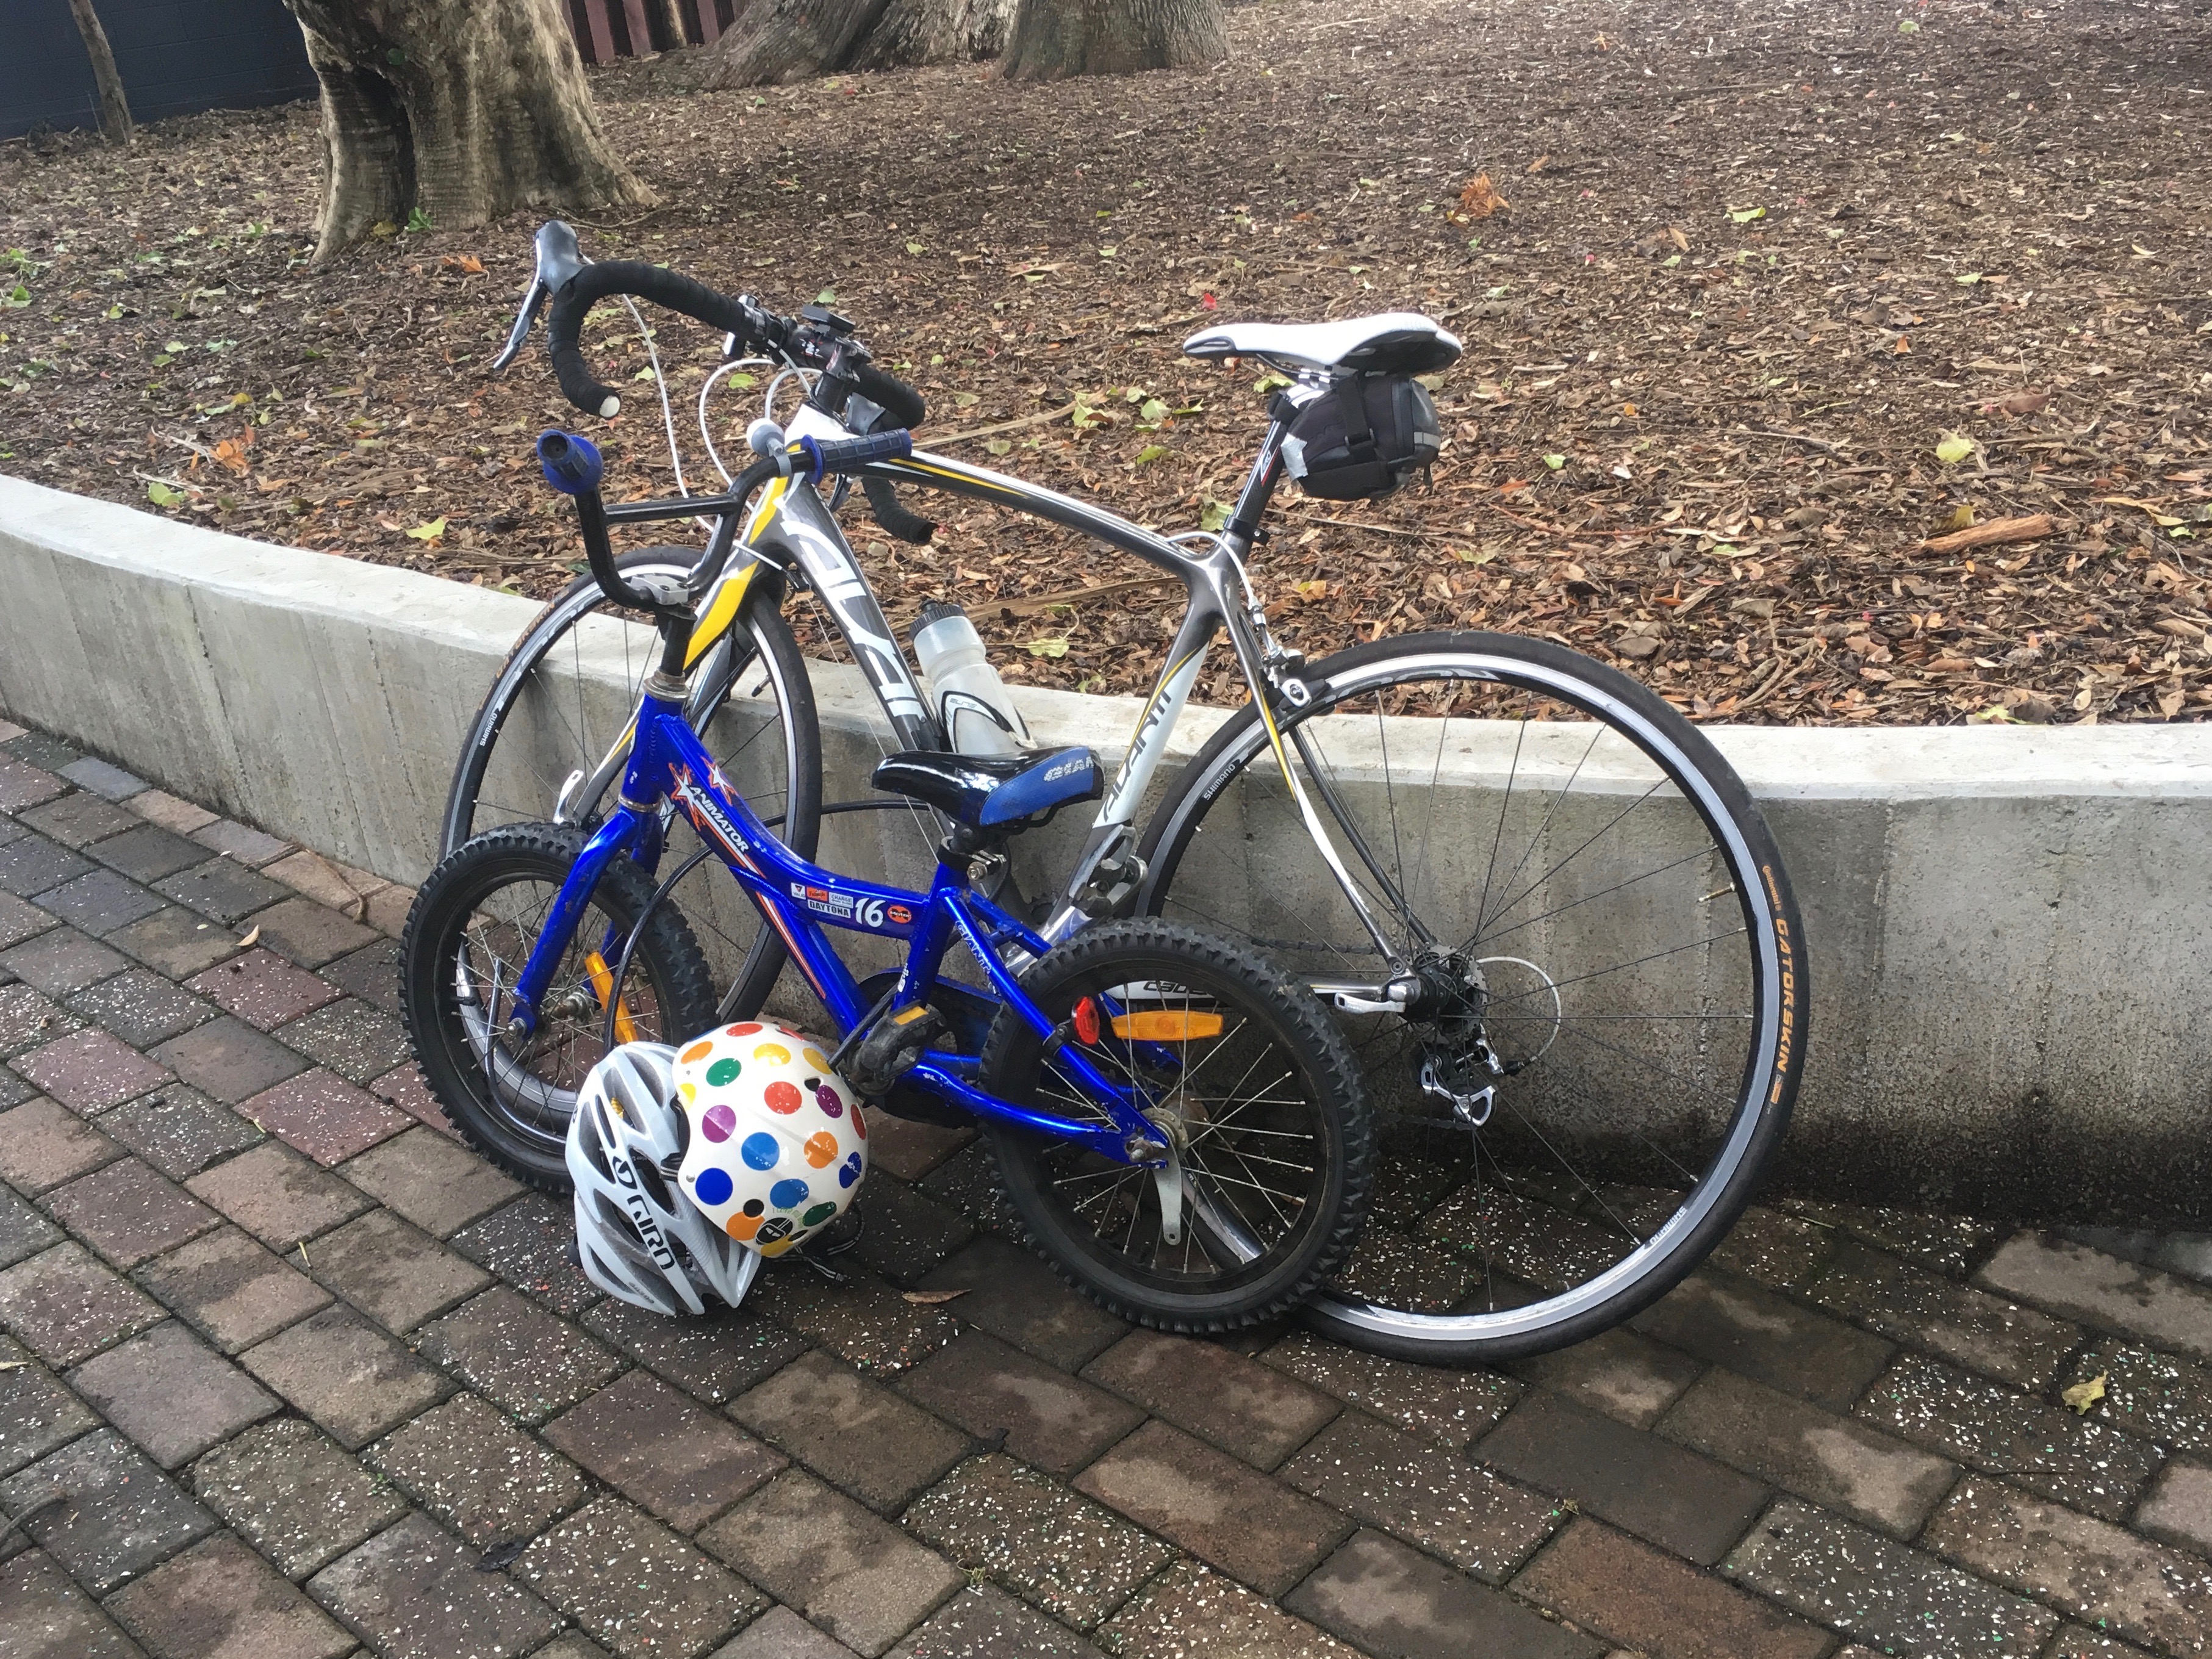
As a Pt Chev local, I’m excited about the proposed bike lanes (NB feedback closes 23 April – have your say here). We’re a ‘bikie’ family: we bike to to school, the shops, the library, the dairy, music lessons, local parks, MOTAT, the zoo, to the doctor, the butcher, the baker. We use the NW cycleway for fresh air and to visit cuzzies, and two of us regularly ride to the city and back for work.
We also walk, bus, and drive to all of those places, which makes for a pretty rounded perspective on what it’s like to move around the ‘hood in different ways, at different times of day.
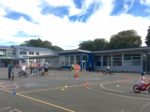
The first thing you notice is that Pt Chev is an incredibly bikeable neighborhood: mostly flat, with nifty shortcuts through parks and alleyways. The only real bugbear is the choice you’re forced to make between riding on the road between parked cars and moving cars, or riding on the footpath (despite the letter of the law) which means going slow, ringing your bell around pedestrians, and constantly watching out for driveways.

But let’s take this beyond anecdote into data. Pt Chev is not just a bikeable neighbourhood – it’s a well-biked neighbourhood. The bike commuting rates are at the high end for Auckland, with a 4% mode share at last census.
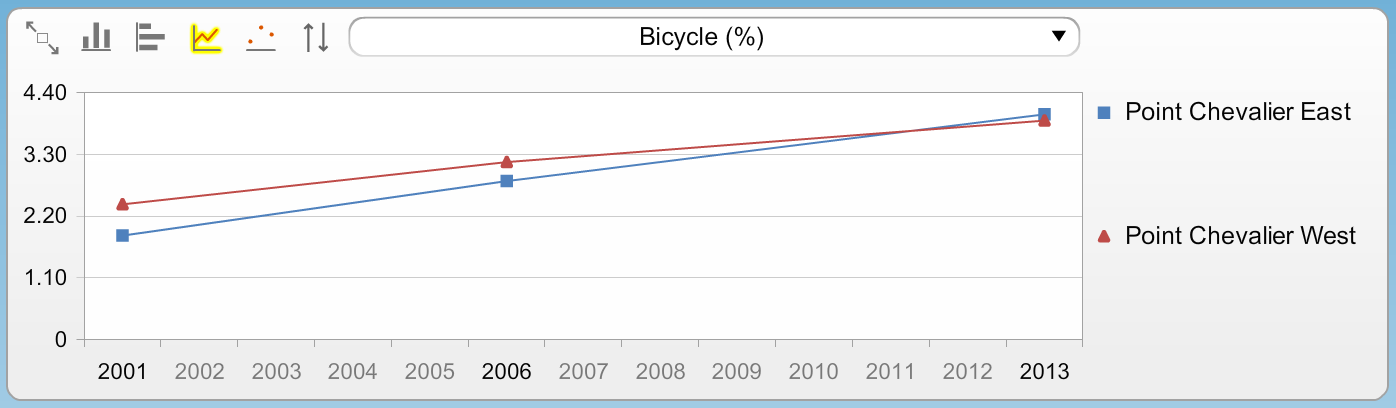
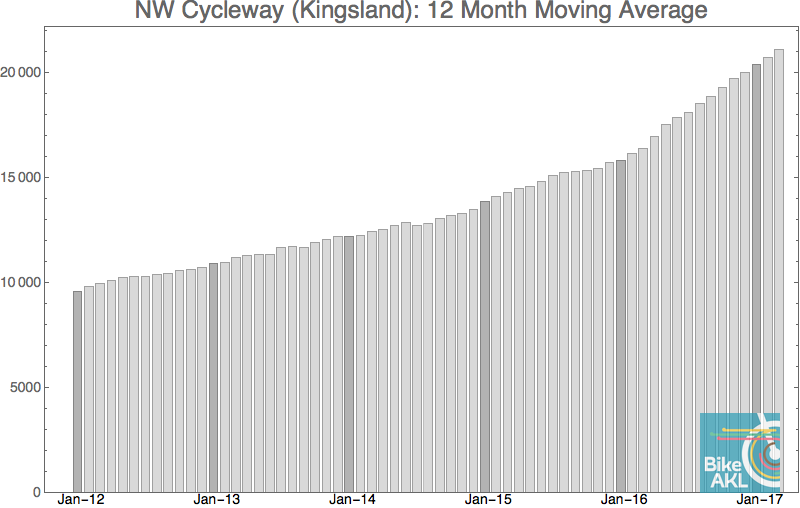
As you can see from the census data, Pt Chev’s rate of biking (to work and study) doubled between 2001 and 2013. And it’s almost certainly higher now, if the growth along the NW cycleway in recent years is any indication.
You’d think that perhaps bus travel had dipped to match the growth in biking – but in fact, it’s stayed steady…

…whereas the proportion of private vehicle commuting has dropped approximately 4% across the same time period. We often talk about encouraging people to step out of the car and try a bike; this looks like solid evidence it’s actually happening!
My guess: people are realizing it’s really not that far to town – half an hour on the bike, with no parking hassles – and it’s well worth avoiding the motorway traffic to arrive home fresh.

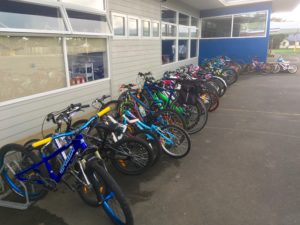
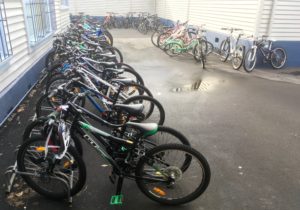
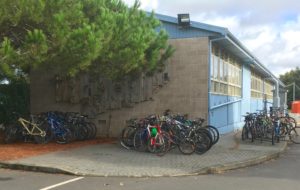
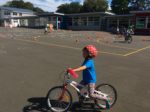
Because Pt Chev adults cycle at a high rate, the kids do too. I did a bike-shed census on a not particularly sunny day a few weeks ago, and around 250 local kids had biked to school. The primary school had the highest number of bikes, but the intermediate had the highest rate, with 25% of the kids repping freedom on wheels; closer to 30% if you include scooters.
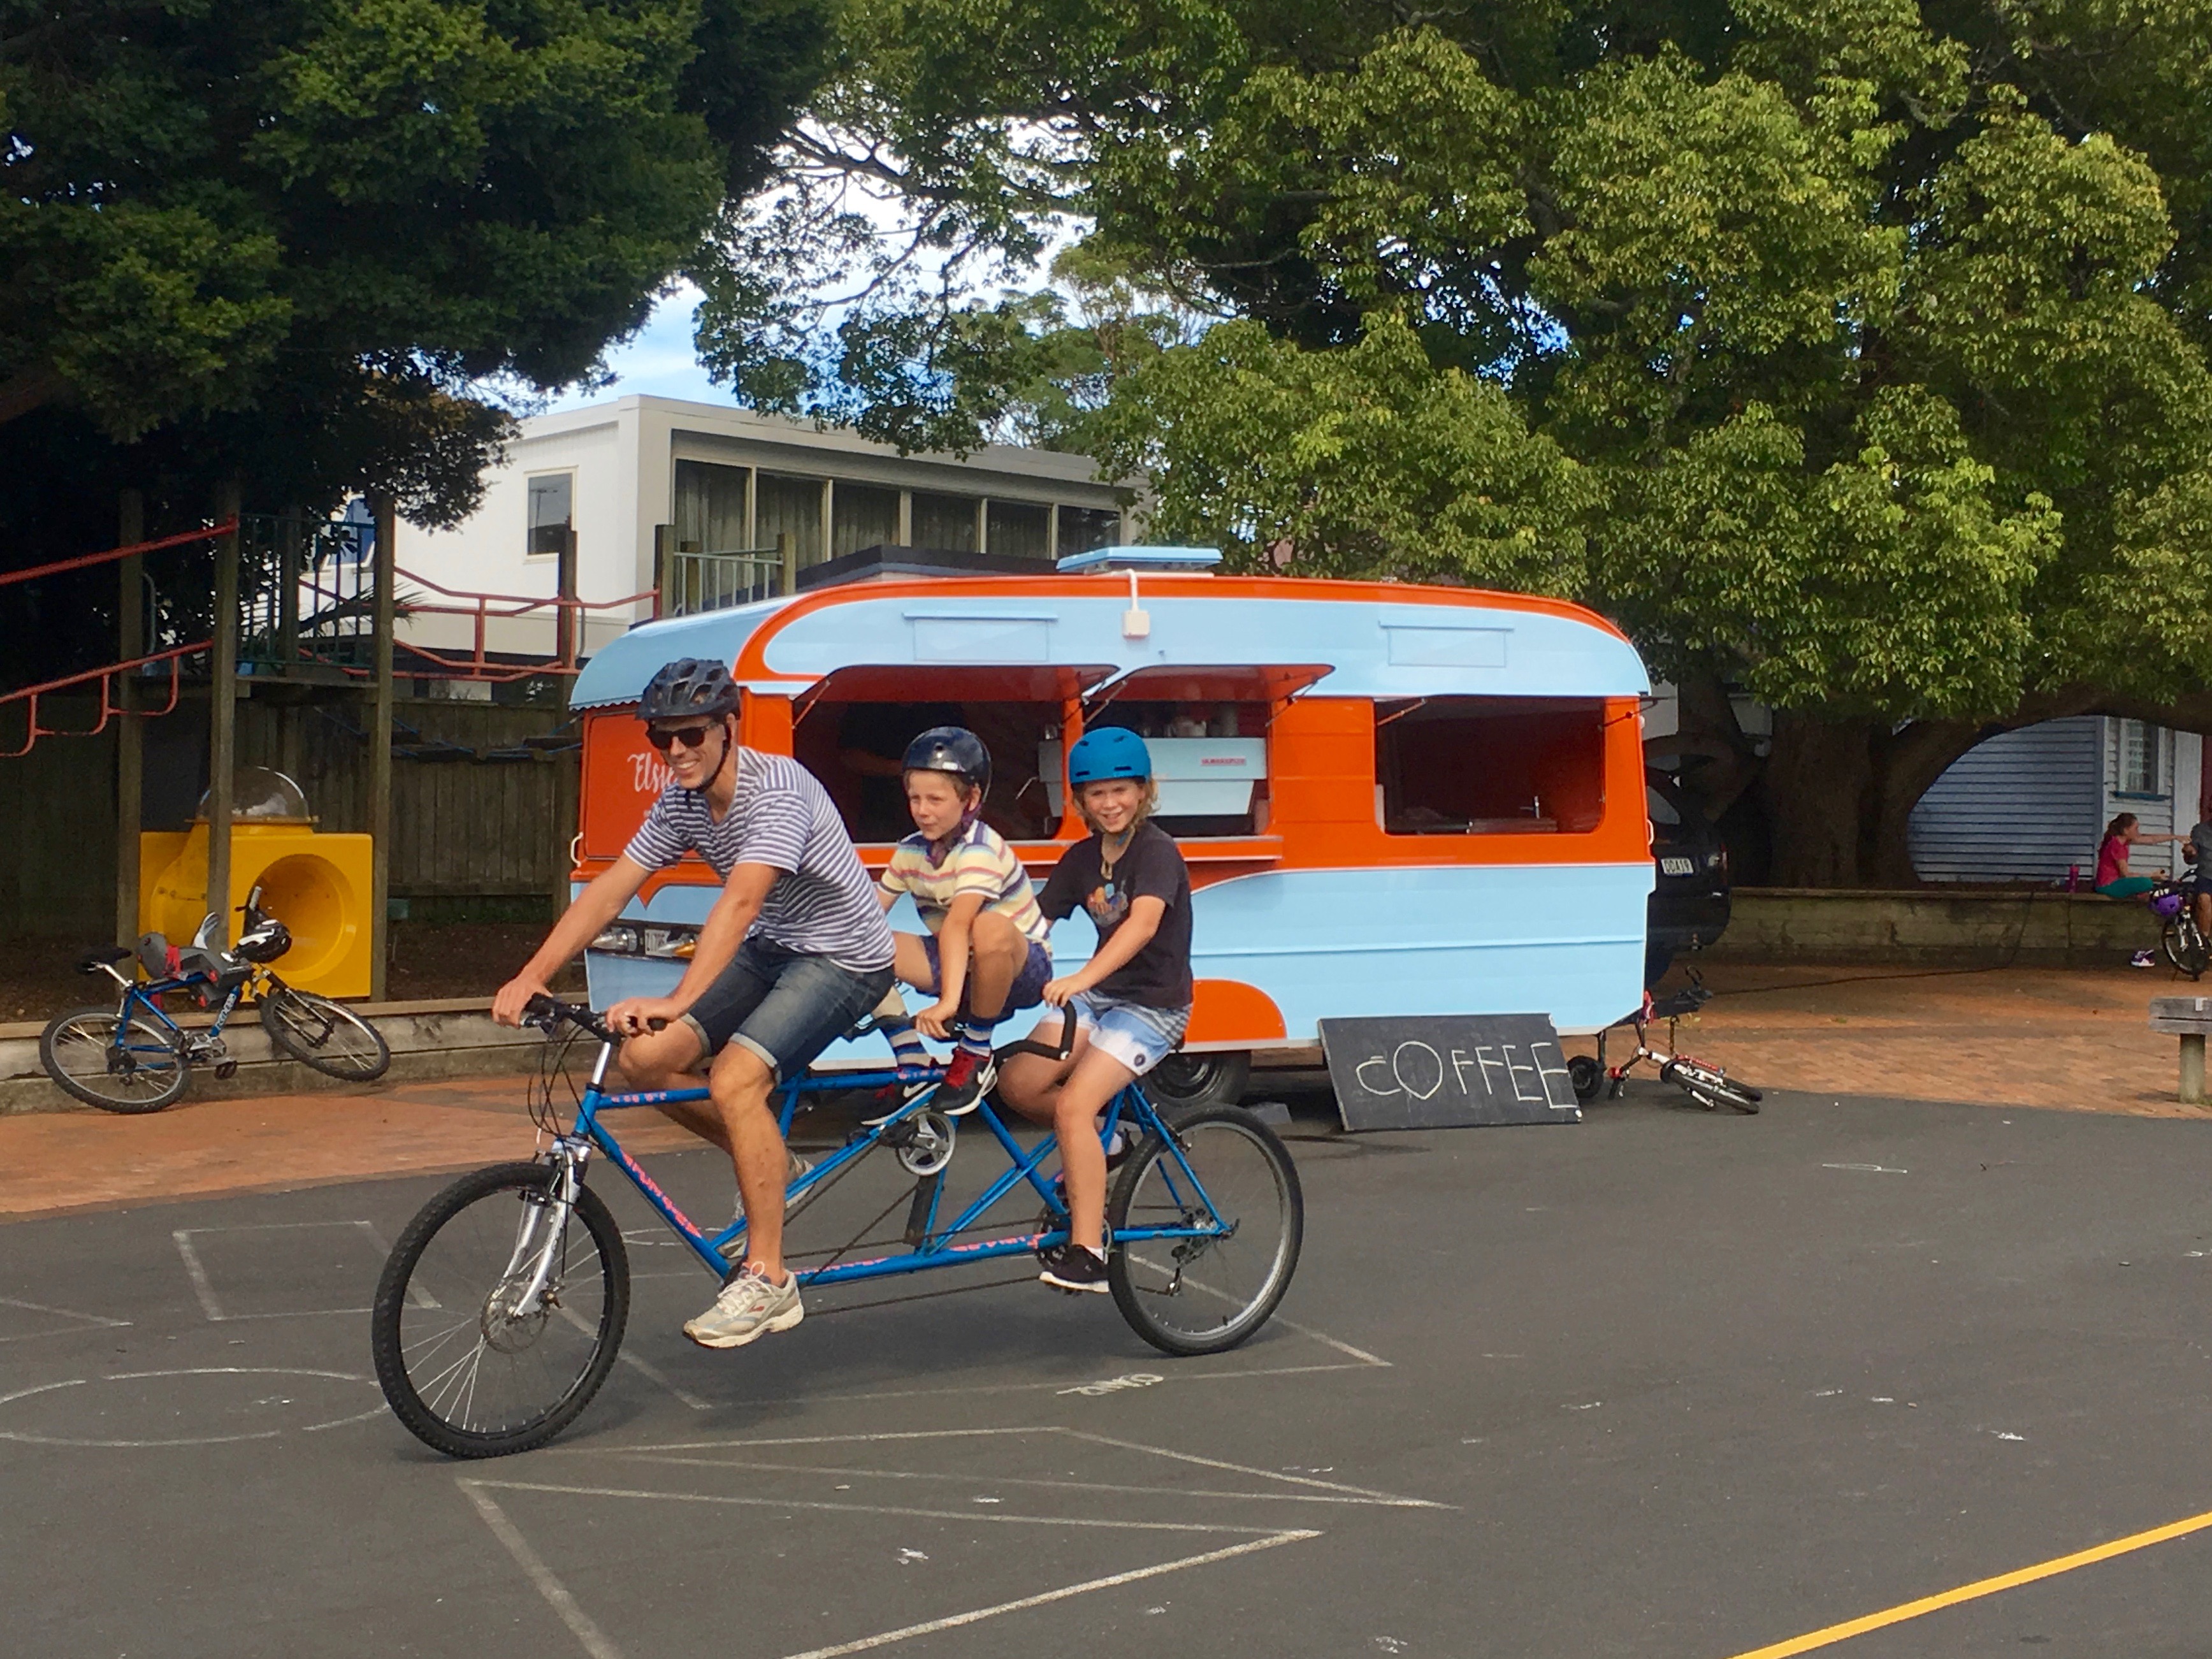
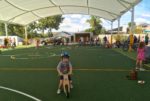
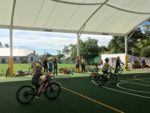
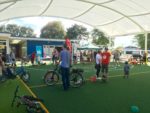
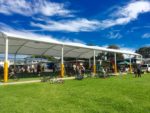
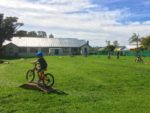
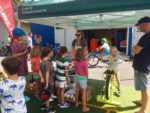
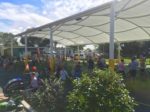
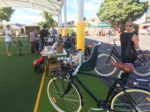
Adding to the local bike enthusiasm were the crowds at the recent Try a Bike Day at Pt Chevalier School: all sorts of people of all ages, keen to ride around for fun, and test-drive e-bikes and cargo bikes.


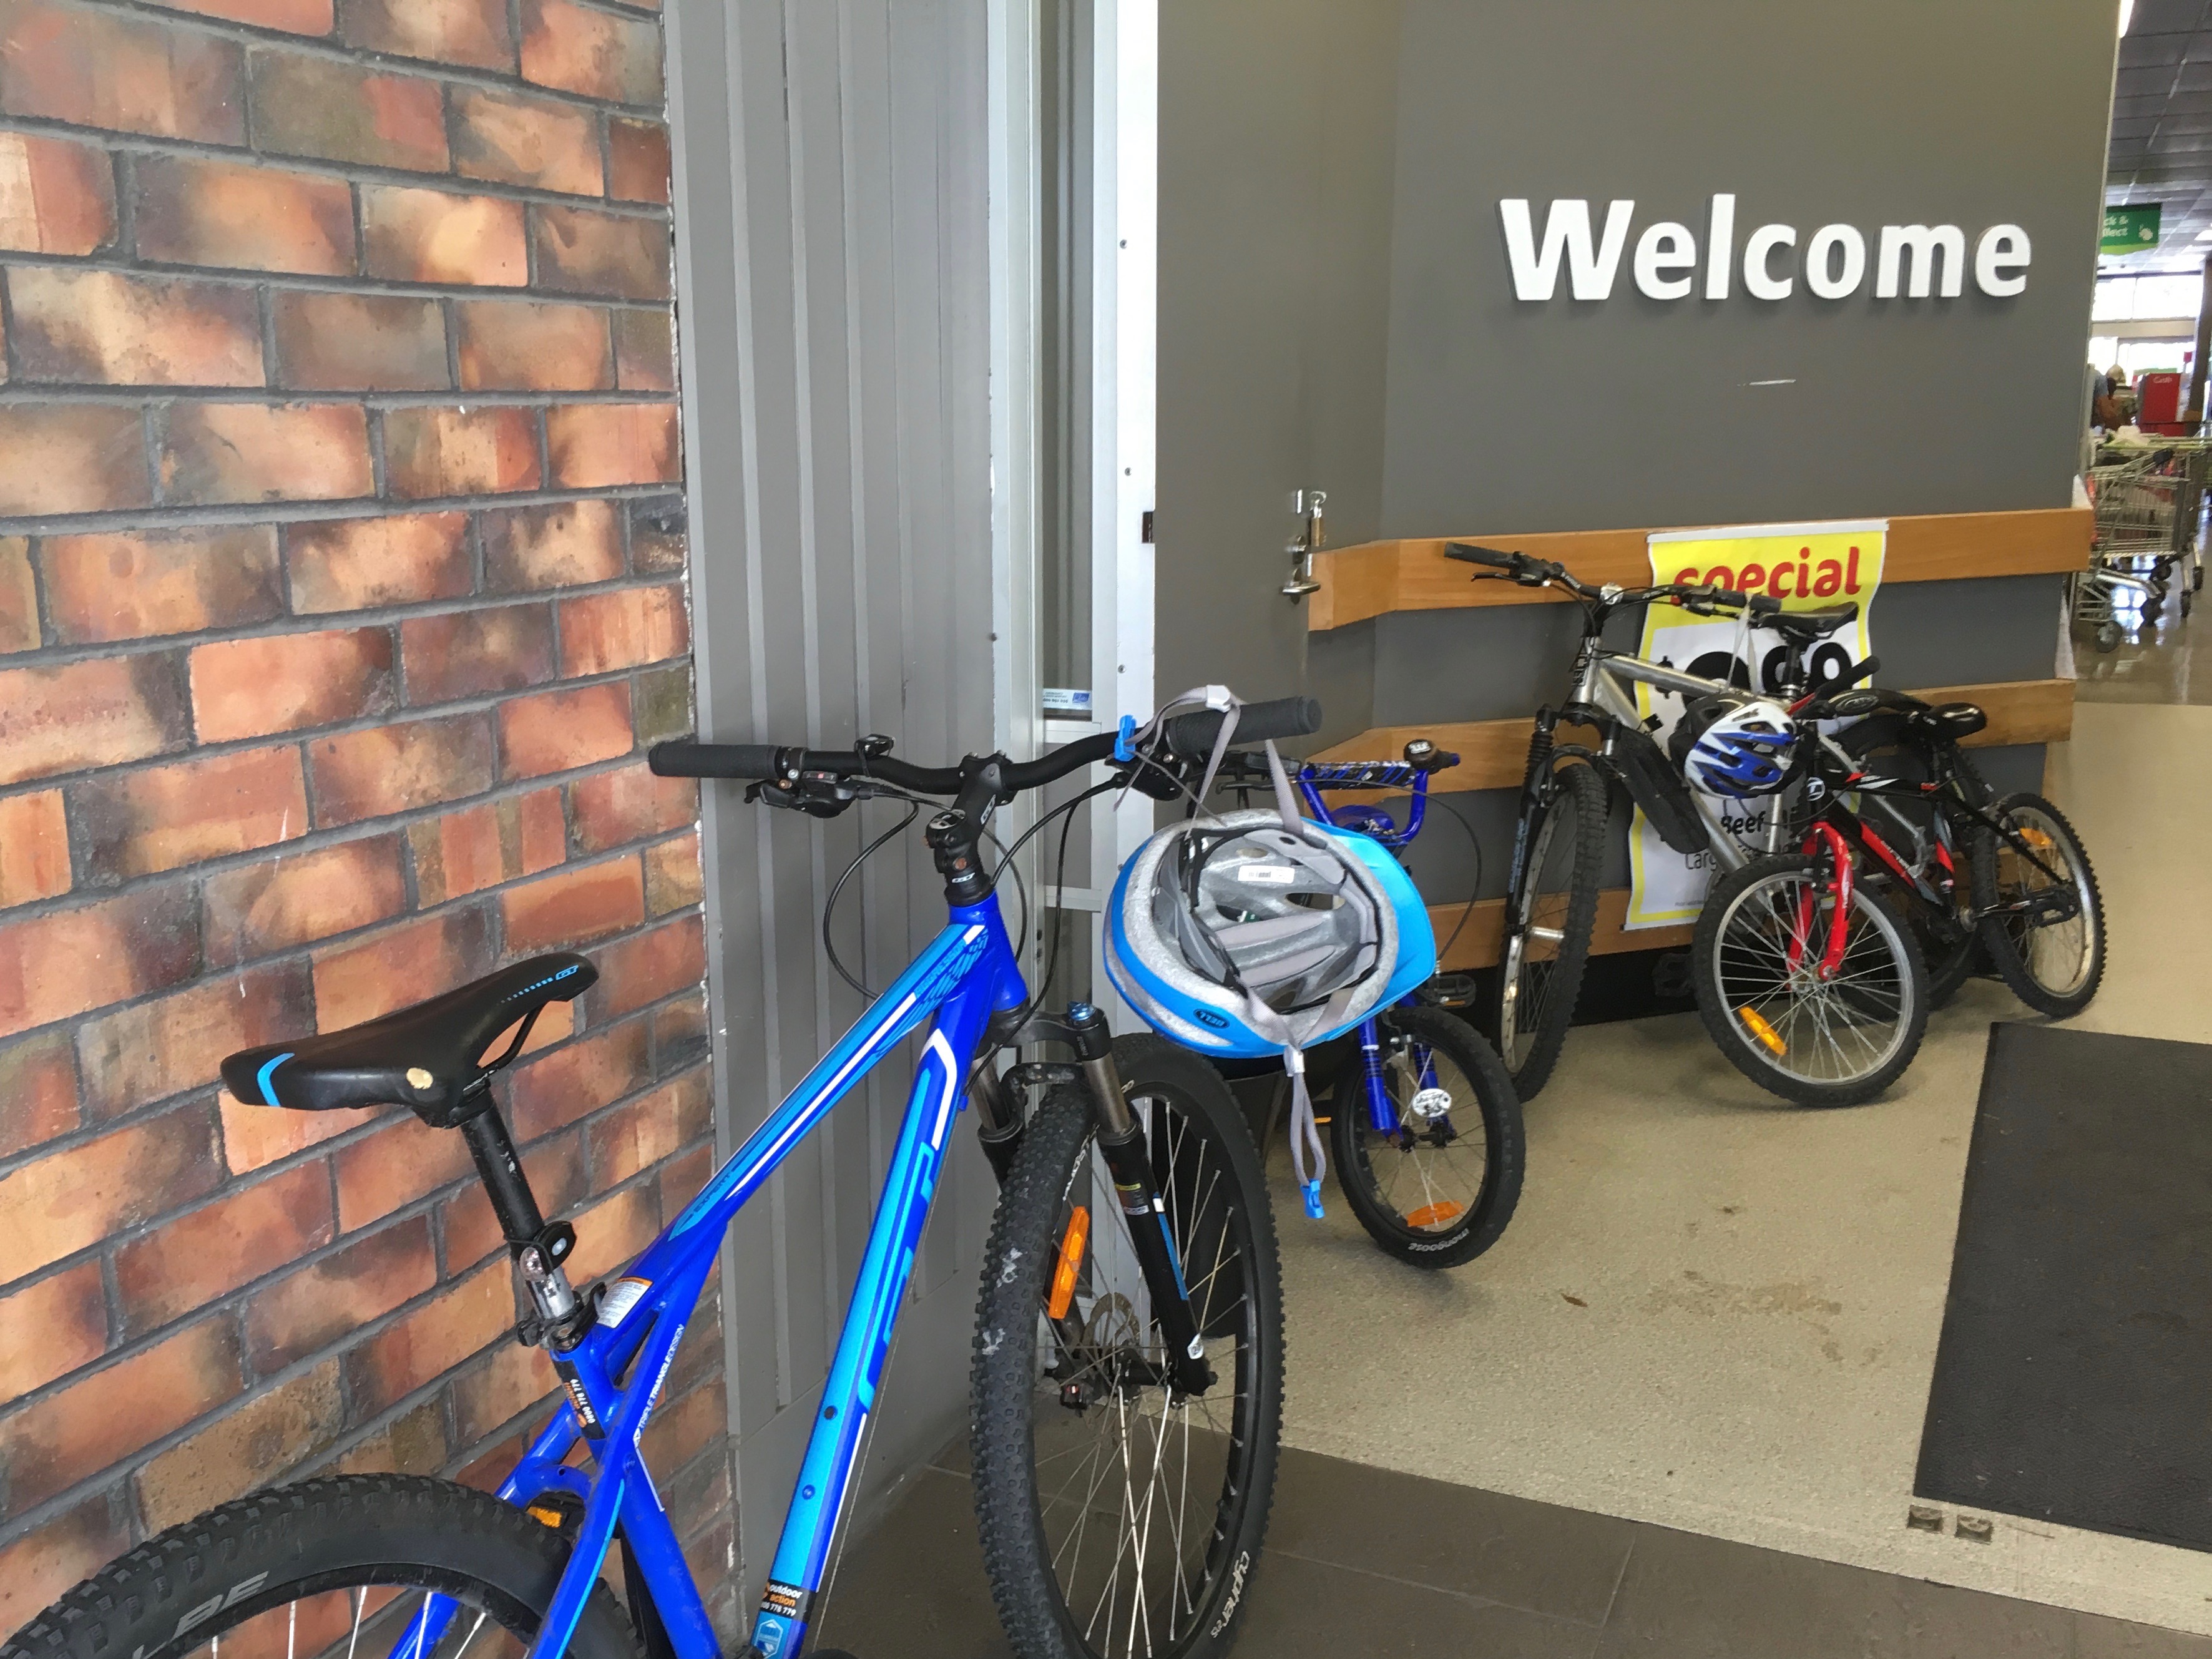
You also see a surprising amount of casual biking to the shops hereabouts. It’s not unusual to see the bike stands stuffed with bikes, especially on a Friday evening.


But it’s hard to measure these local trips – because they’re not counted in the census, and the automated cycleway counters tend to be on the protected and connected cycleways.
Luckily, as part of this project, Auckland Transport did a count of bikes on Pt Chev Road, covering both the footpath and the roadway, and the numbers are really interesting. You can click on the images below to enlarge them, but we’ve boiled down the data and cross-correlated it with weather for the weeks the measurements were made…
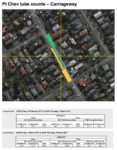
- All told, on-road + footpath trips give a range of 340 – 450 ADT (average daily trips), depending on the weather and day of the week.
- ADT for bikes on the roadway is roughly 300 in very good weather, and still in the 220-240 range in one of the rainiest weeks in recent records. There’s also a small but noticeable uptick on the weekends (roadies?).
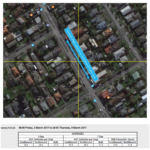
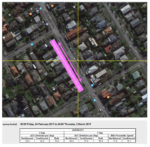
- The footpath data is a bit trickier, as each side was measured on a different week, one fine and one very wet. Regardless, counting both sides and averaging out the weather, the data suggests that on average you see at least 130 footpath trips per day. Assuming an equal balance of traffic on both sides, you’d see 150 ADT on a good day, and still 114 on a wet day.
- The 7-day footpath ADT is slightly lower than the Monday-to-Friday number, suggesting school bike traffic dominates the footpath trips; but there’s still significant weekend footpath riding. Families out and about?
Also worth noting: the average footpath speed is around half that of the on-road bike traffic. And if you run these numbers against the census data, you can reasonably assume a half/half split between commutes/local trips.
Clearly the local demand is strong, and rising. So what’s stopping more Pt Chevians from biking and, for that matter, walking?

It’s summed up in this comment from a discussion on the local real estate page (thread since removed): “As someone who lives in Pt Chev & frequents many of these businesses, I drive to them because it’s too scary to cycle. If it was easy and safe, I would be very happy to cycle around the neighborhood. I think it would wind up with more people getting out and about, and ultimately more business rather than less.”
The elephant in the room is the through-traffic. Auckland Transport’s traffic counts tell the story: every day, around 16,000 vehicle trips pour through Pt Chevalier Road, with about 85% of that number swinging in or out via Meola Road. These movements are tidal, flowing into the city in the morning; outwards in the afternoon. Some will be locals; the majority are not.
(NB the traffic data we don’t yet have: what’ll happen when the Waterview Tunnel opens.)
If you’re biking or walking, there’s actually a physical sensation when you pass that Pt Chev/Meola intersection dividing line, like when you’re swimming at the beach and you suddenly enter a cold zone. Same wide road, same parked cars, same wide footpaths, same locals coming in and out of driveways… but oh, that river of through-traffic.
It’s hard to blame the drivers – they’re behaving logically: when the motorway’s stuffed, you’ll find a way around – and the road (however narrow or lined with shops or with kids trying to get to school) will lead you there.
It wasn’t always this way – but locals have increasingly shaped their movements around this tidal traffic. Watch local drivers hang a right at Walford rather than chance Meola in the evenings. Watch how walkers on Pt Chev Rd gravitate to the west side rather than cross at the alarming Meola intersection. Watch Joan, the volunteer crossing guard, shuttling school kids through the only safe link from ‘SoMeo’ to ‘NoMeo’, morning and afternoon. Watch the frustration of those who live on the ‘bird’ streets, as people roar through, treating them as parallel alternatives to Pt Chev Rd. Watch people biking on the footpath, and kids and older residents afraid to cross at side streets.
It’s beyond time to change these priorities for the better. And Pt Chev will be a perfect example-case for making Auckland’s neighbourhoods friendlier for walking and biking. More traffic is coming, whether we want it or not. Let’s be ready, by making space for the kinds of travel that make local streets all the sweeter.
Even if – especially if! – you have specific concerns or questions about the details of the design, it’s really important to support this project in principle, and to add your suggestions to make it even better. So please speak up!
Feedback closes Sunday 23 April. Have your say now.
This is #2 in a series – read the first part here.


