Have you been just a bit more likely to take the car, bus or train in recent weeks? No? Good on you. But if you decided that it was just looking a bit more humid than usual out there, you weren’t mistaken. September 2016 wasn’t much colder than usual, but it was wet. How wet? Let’s start with the rainfall statistics from Metservice…
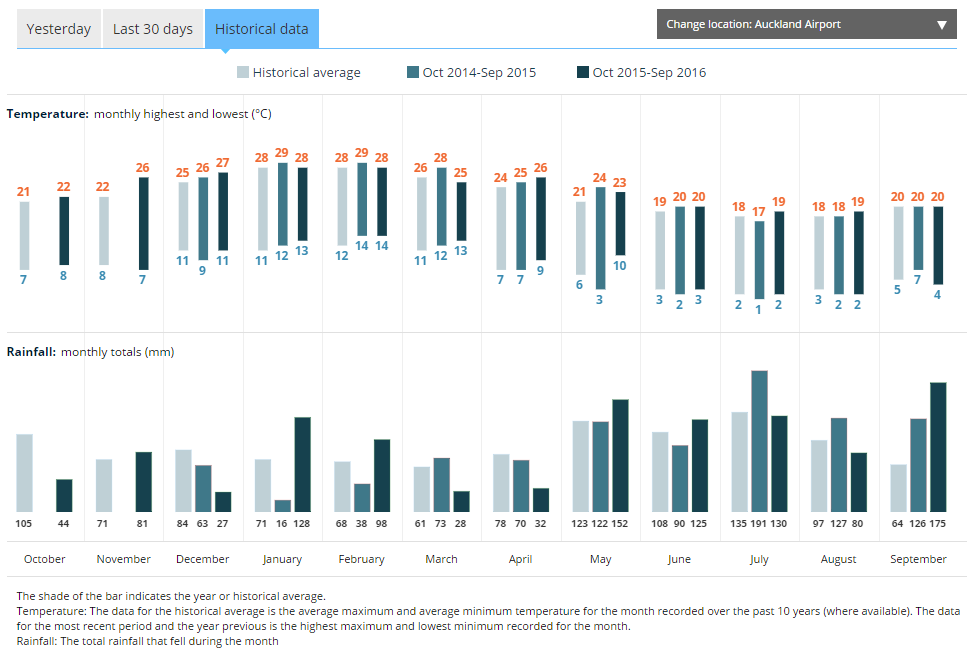 A September almost three times as wet as the historical average, and good bit wetter than last year too. You’d expect bike numbers to drop a bit under those circumstances, eh?
And yet citywide bike trips are up, as measured by the 14 bike counters spread across the region! Both compared to both the previous twelve months, and compared to this time last year:
- 1.66 million cycle trips were recorded for the year of October 2015 to September 2016, an increase of 8.8% on the previous 12 months.
- 119,142 cycle trips were recorded in September 2016, an increase of 4.8% when compared to September 2015.
Numbers are also rising in the city centre, where a new ‘cordon’ of 13 counters is tracking people entering and leaving the CBD on bikes. Although there’s not yet enough data from the new counters to compare with previous years, the total number of trips here is even higher than the regional count.
This is likely a combo of the fact that’s where the interconnected protected cycleways converge, and the sheer density of employment and education in the city centre.
- 1.75 million cycle trips were recorded/estimated for the year of October 2015 to September 2016
- 122,697 cycle trips were recorded in September 2016.
How are these numbers tracking against the official targets? Very nicely indeed; glad you asked. NB: the city centre targets are the ones to watch. They’re outlined in Auckland Transport’s 2015 Statement of Intent – and are the primary focus for now, in terms of meeting the Urban Cycleways Programme target of a 30% increase in bike trips by 2019. (The regional/LTP targets come from the Council’s Long Term Plan).
 So we are smashing the Regional/Long Term Plan targets nicely, and are tracking right along for the Statement of Intent/City Centre targets.
At the risk of repeating ourselves (see July and August), there are dramatic differences in bike counts between the oases of improved/ protected/ connected cycleways, and those in bike infrastructure ‘deserts’, even the more heavily trafficked ones.
By all means dig into the raw data from Auckland Transport; or check out our full set of graphs here (Dropbox link) and tell us what you see. But for discussion, we’ve extracted a few striking examples…
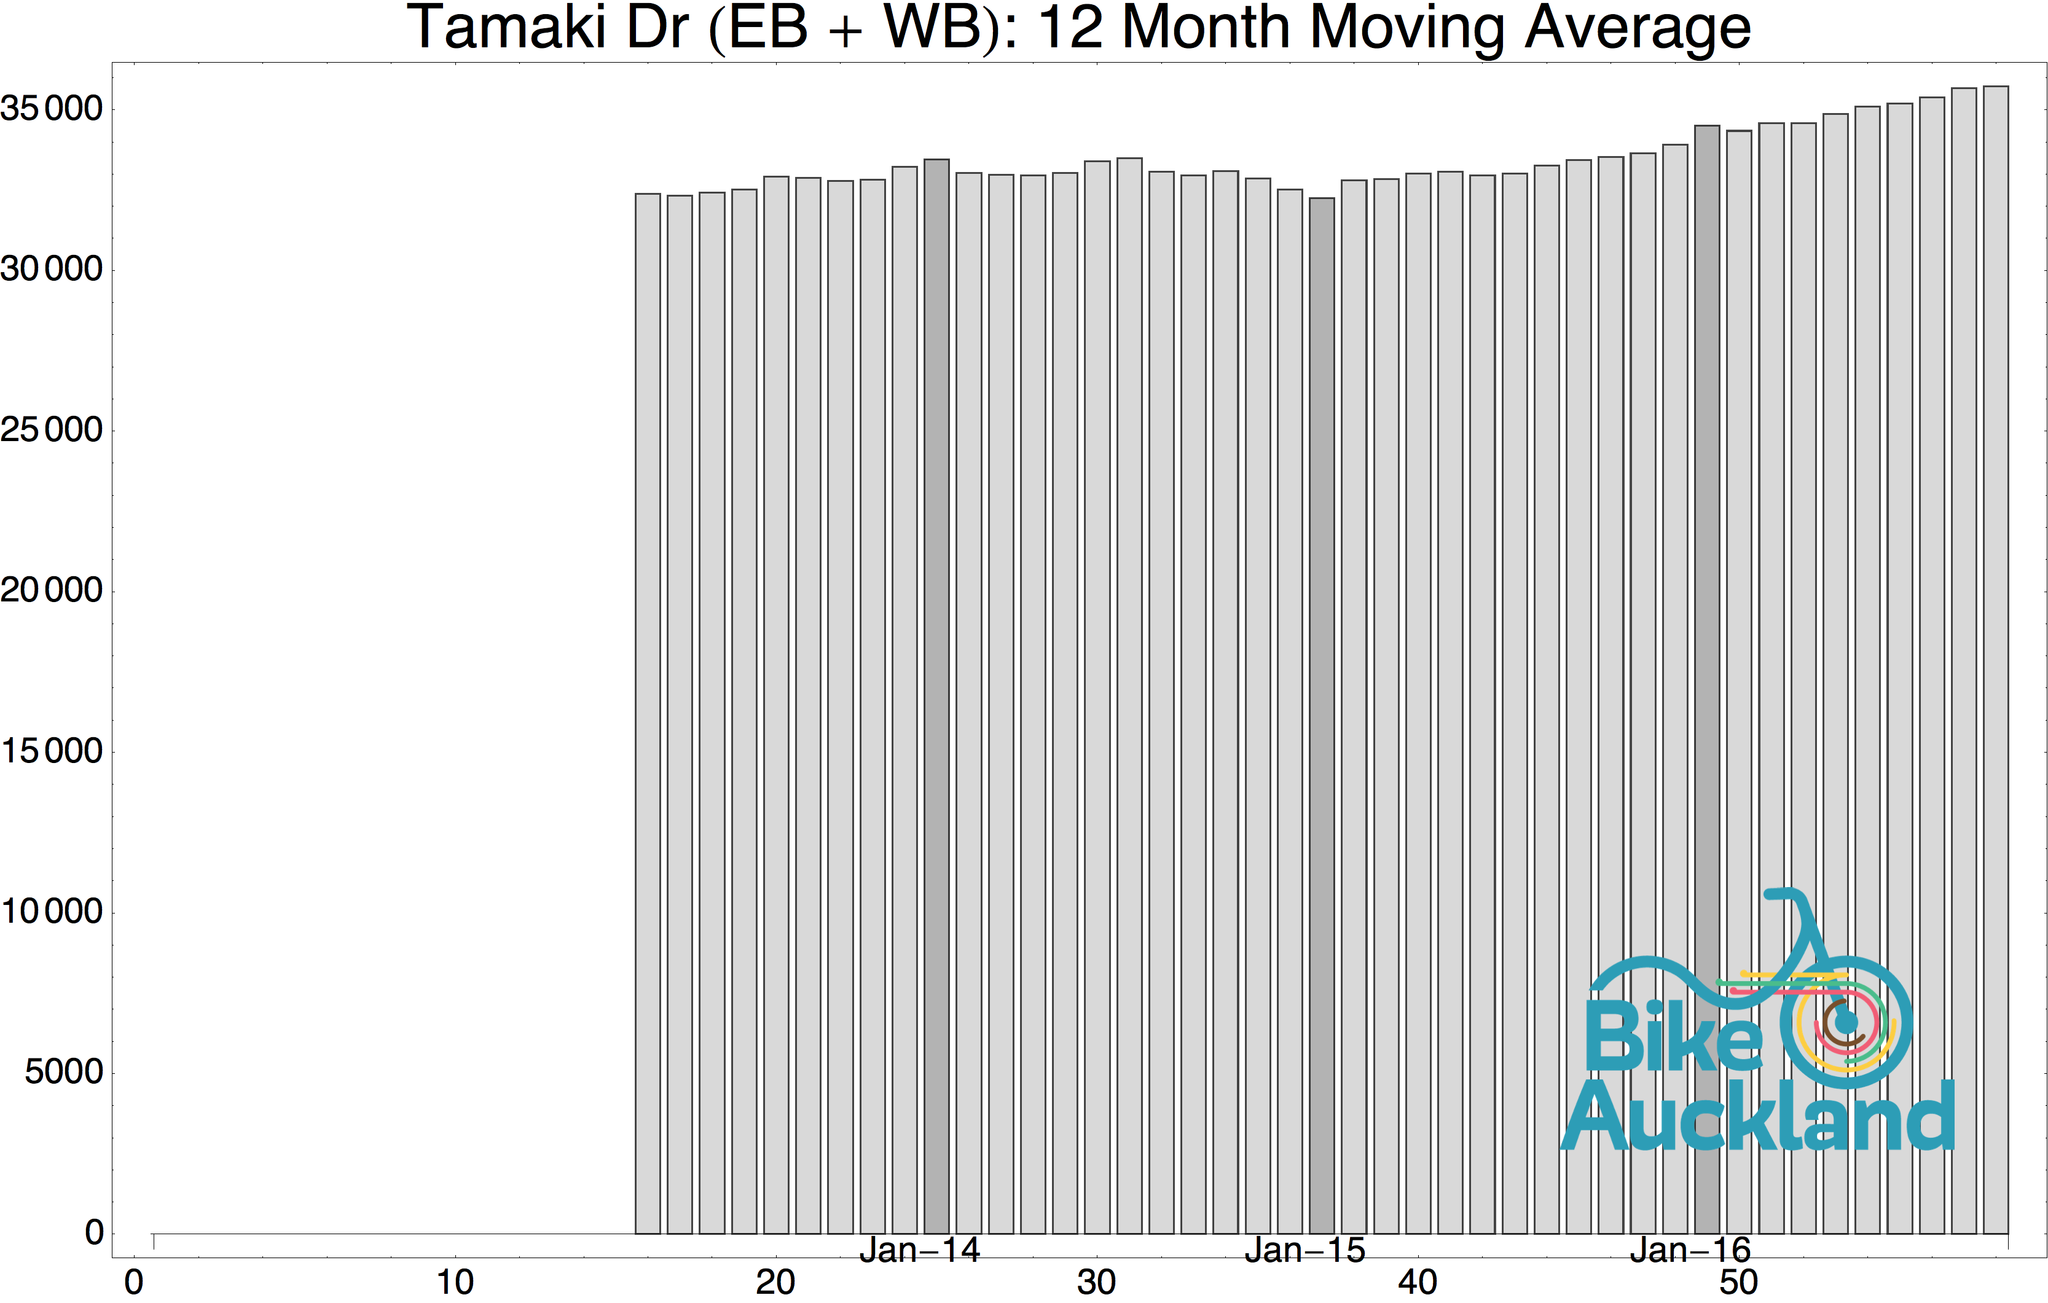
Tamaki Drive, our busiest route, continues to rise steadily. A significant number of these riders likely continue along Quay St and boost the numbers on the totem counter.

Mangere Bridge, usually an instance of ‘steady as she goes’, is showing some dampening, dropping lower than its usual minimum. The 12 month average is hanging in there at over 10,000 people a month, which is still not small beer. But we’d be curious if you know of any specific reasons for the drop?
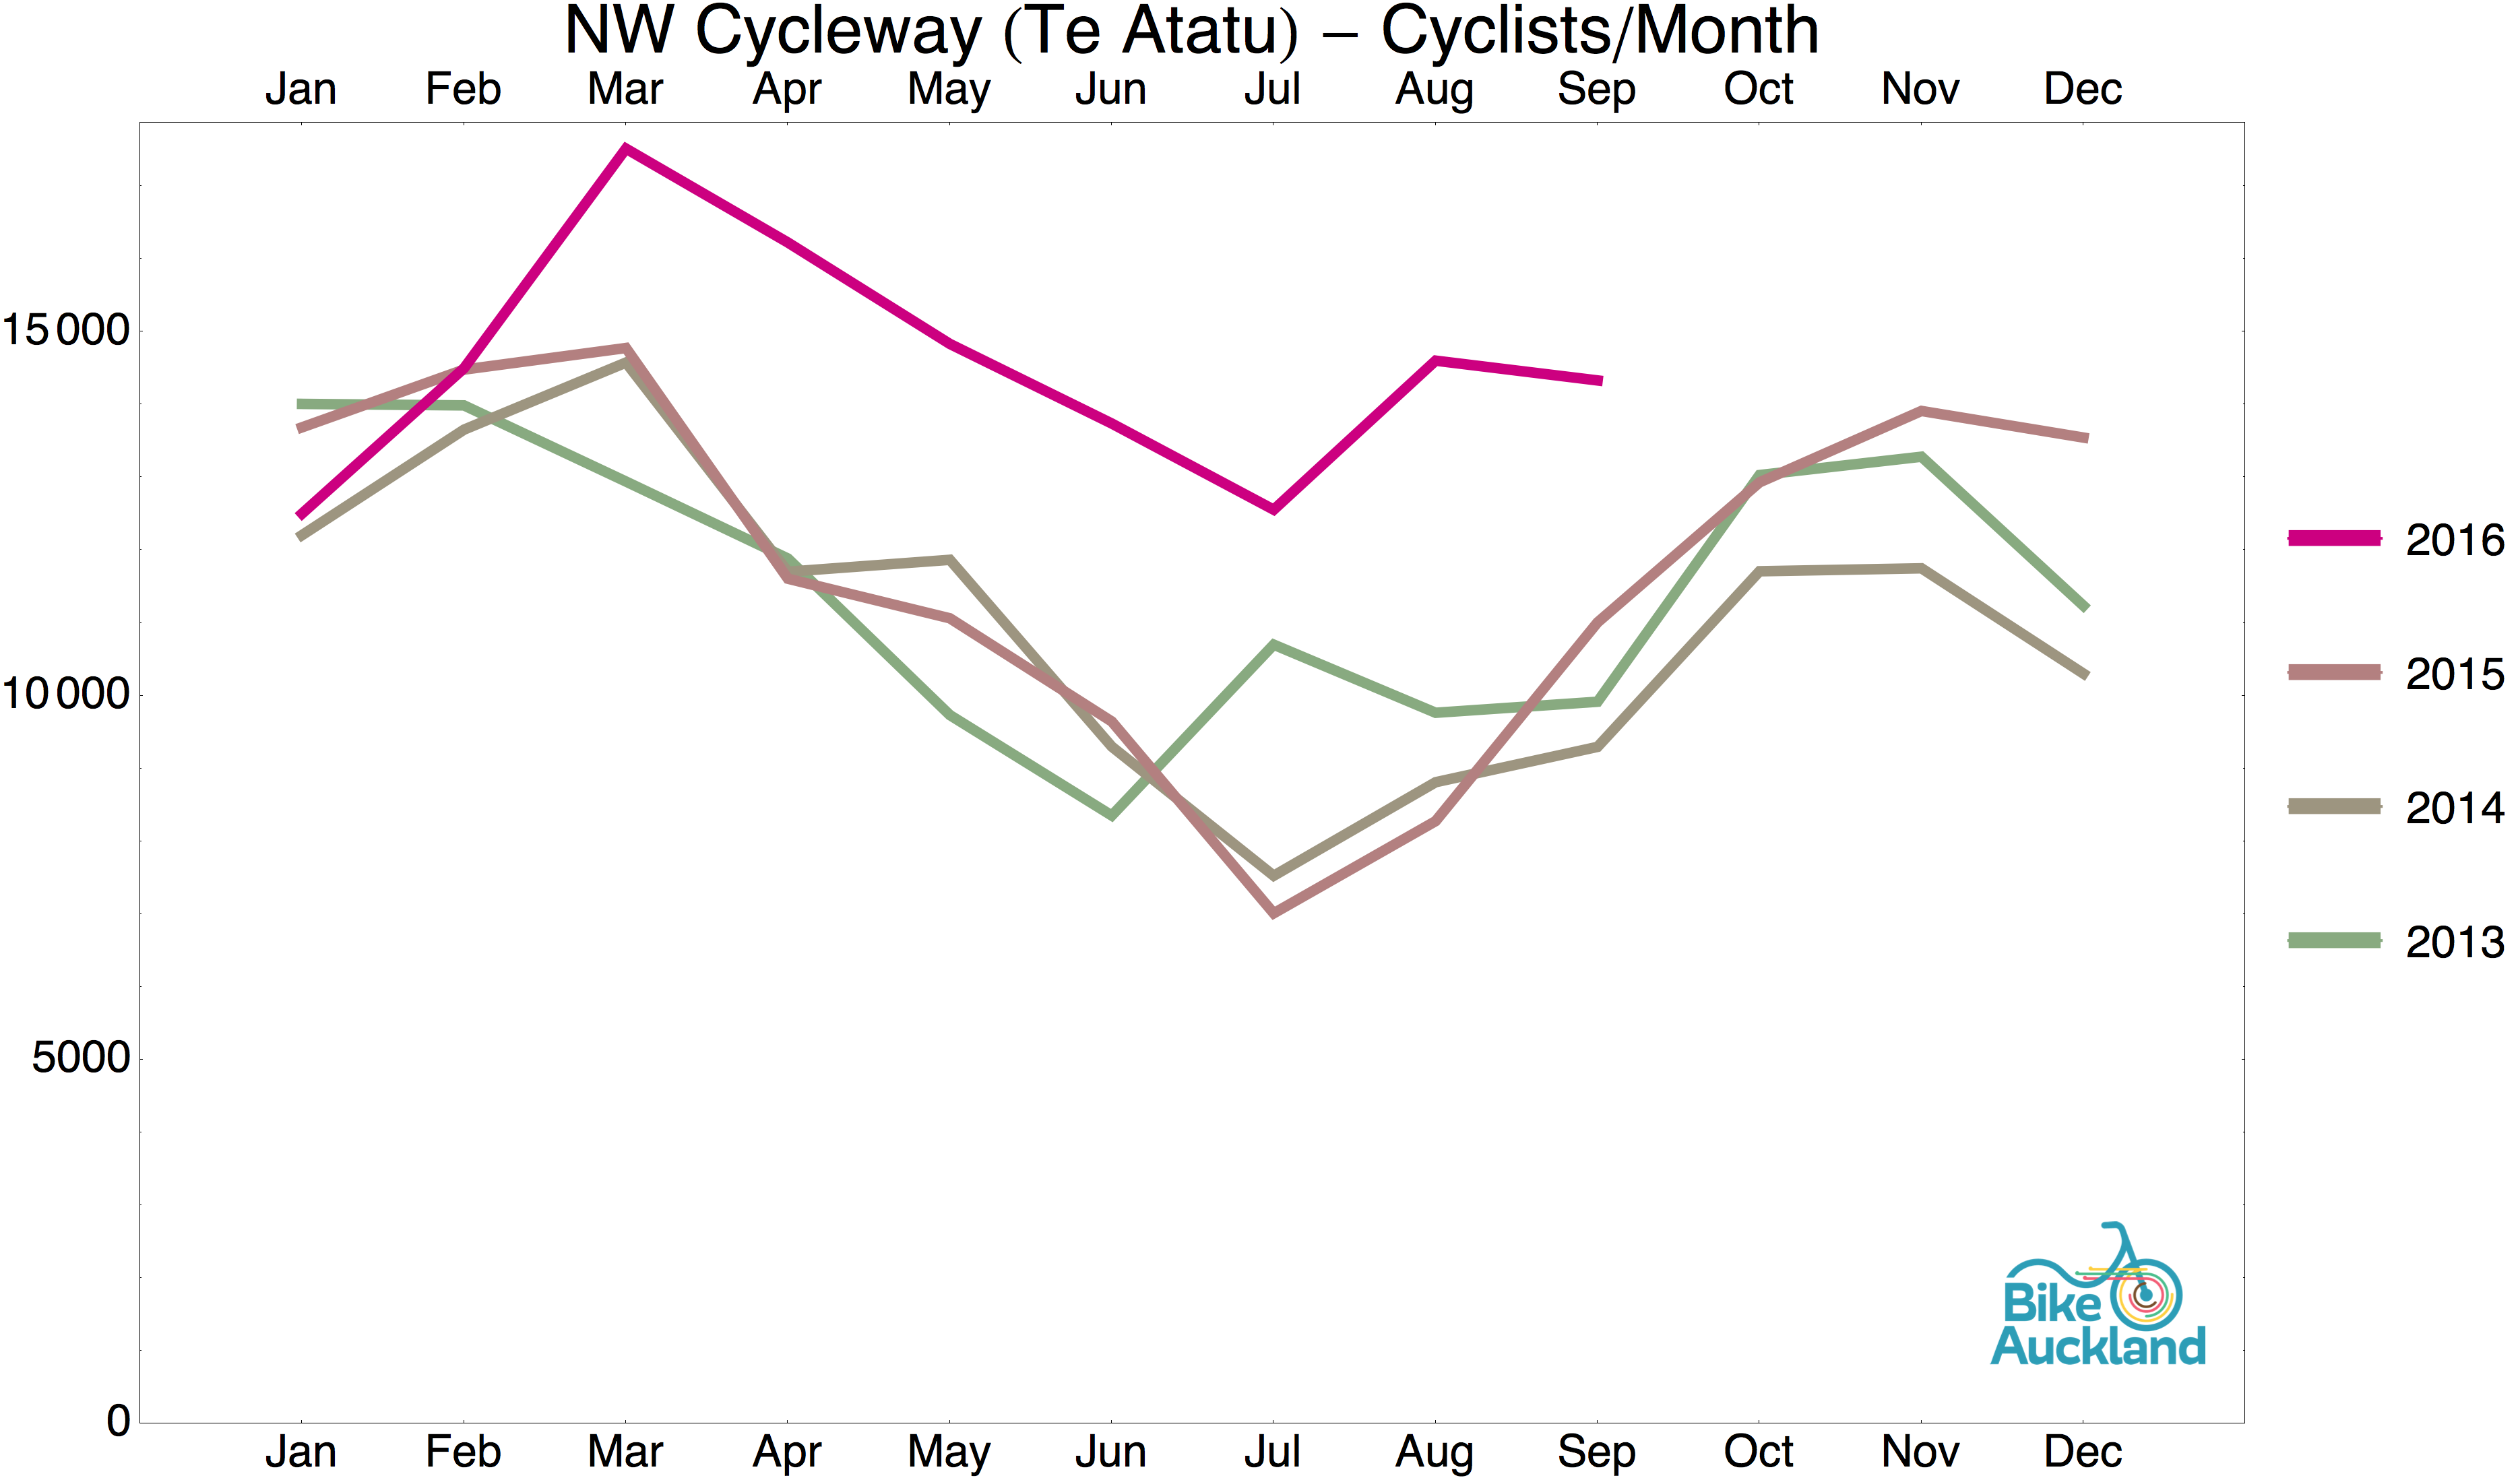
 Now take a look at the gold standard cycleways from the west and into the city. Here’s where the rubber is really hitting the cyclepath. As they say of the US postal service: Neither snow nor rain nor heat nor gloom of night stays these couriers from the swift completion of their appointed rounds.’ Not that these people are couriers: they’re just regular Aucklanders getting where they’re going.
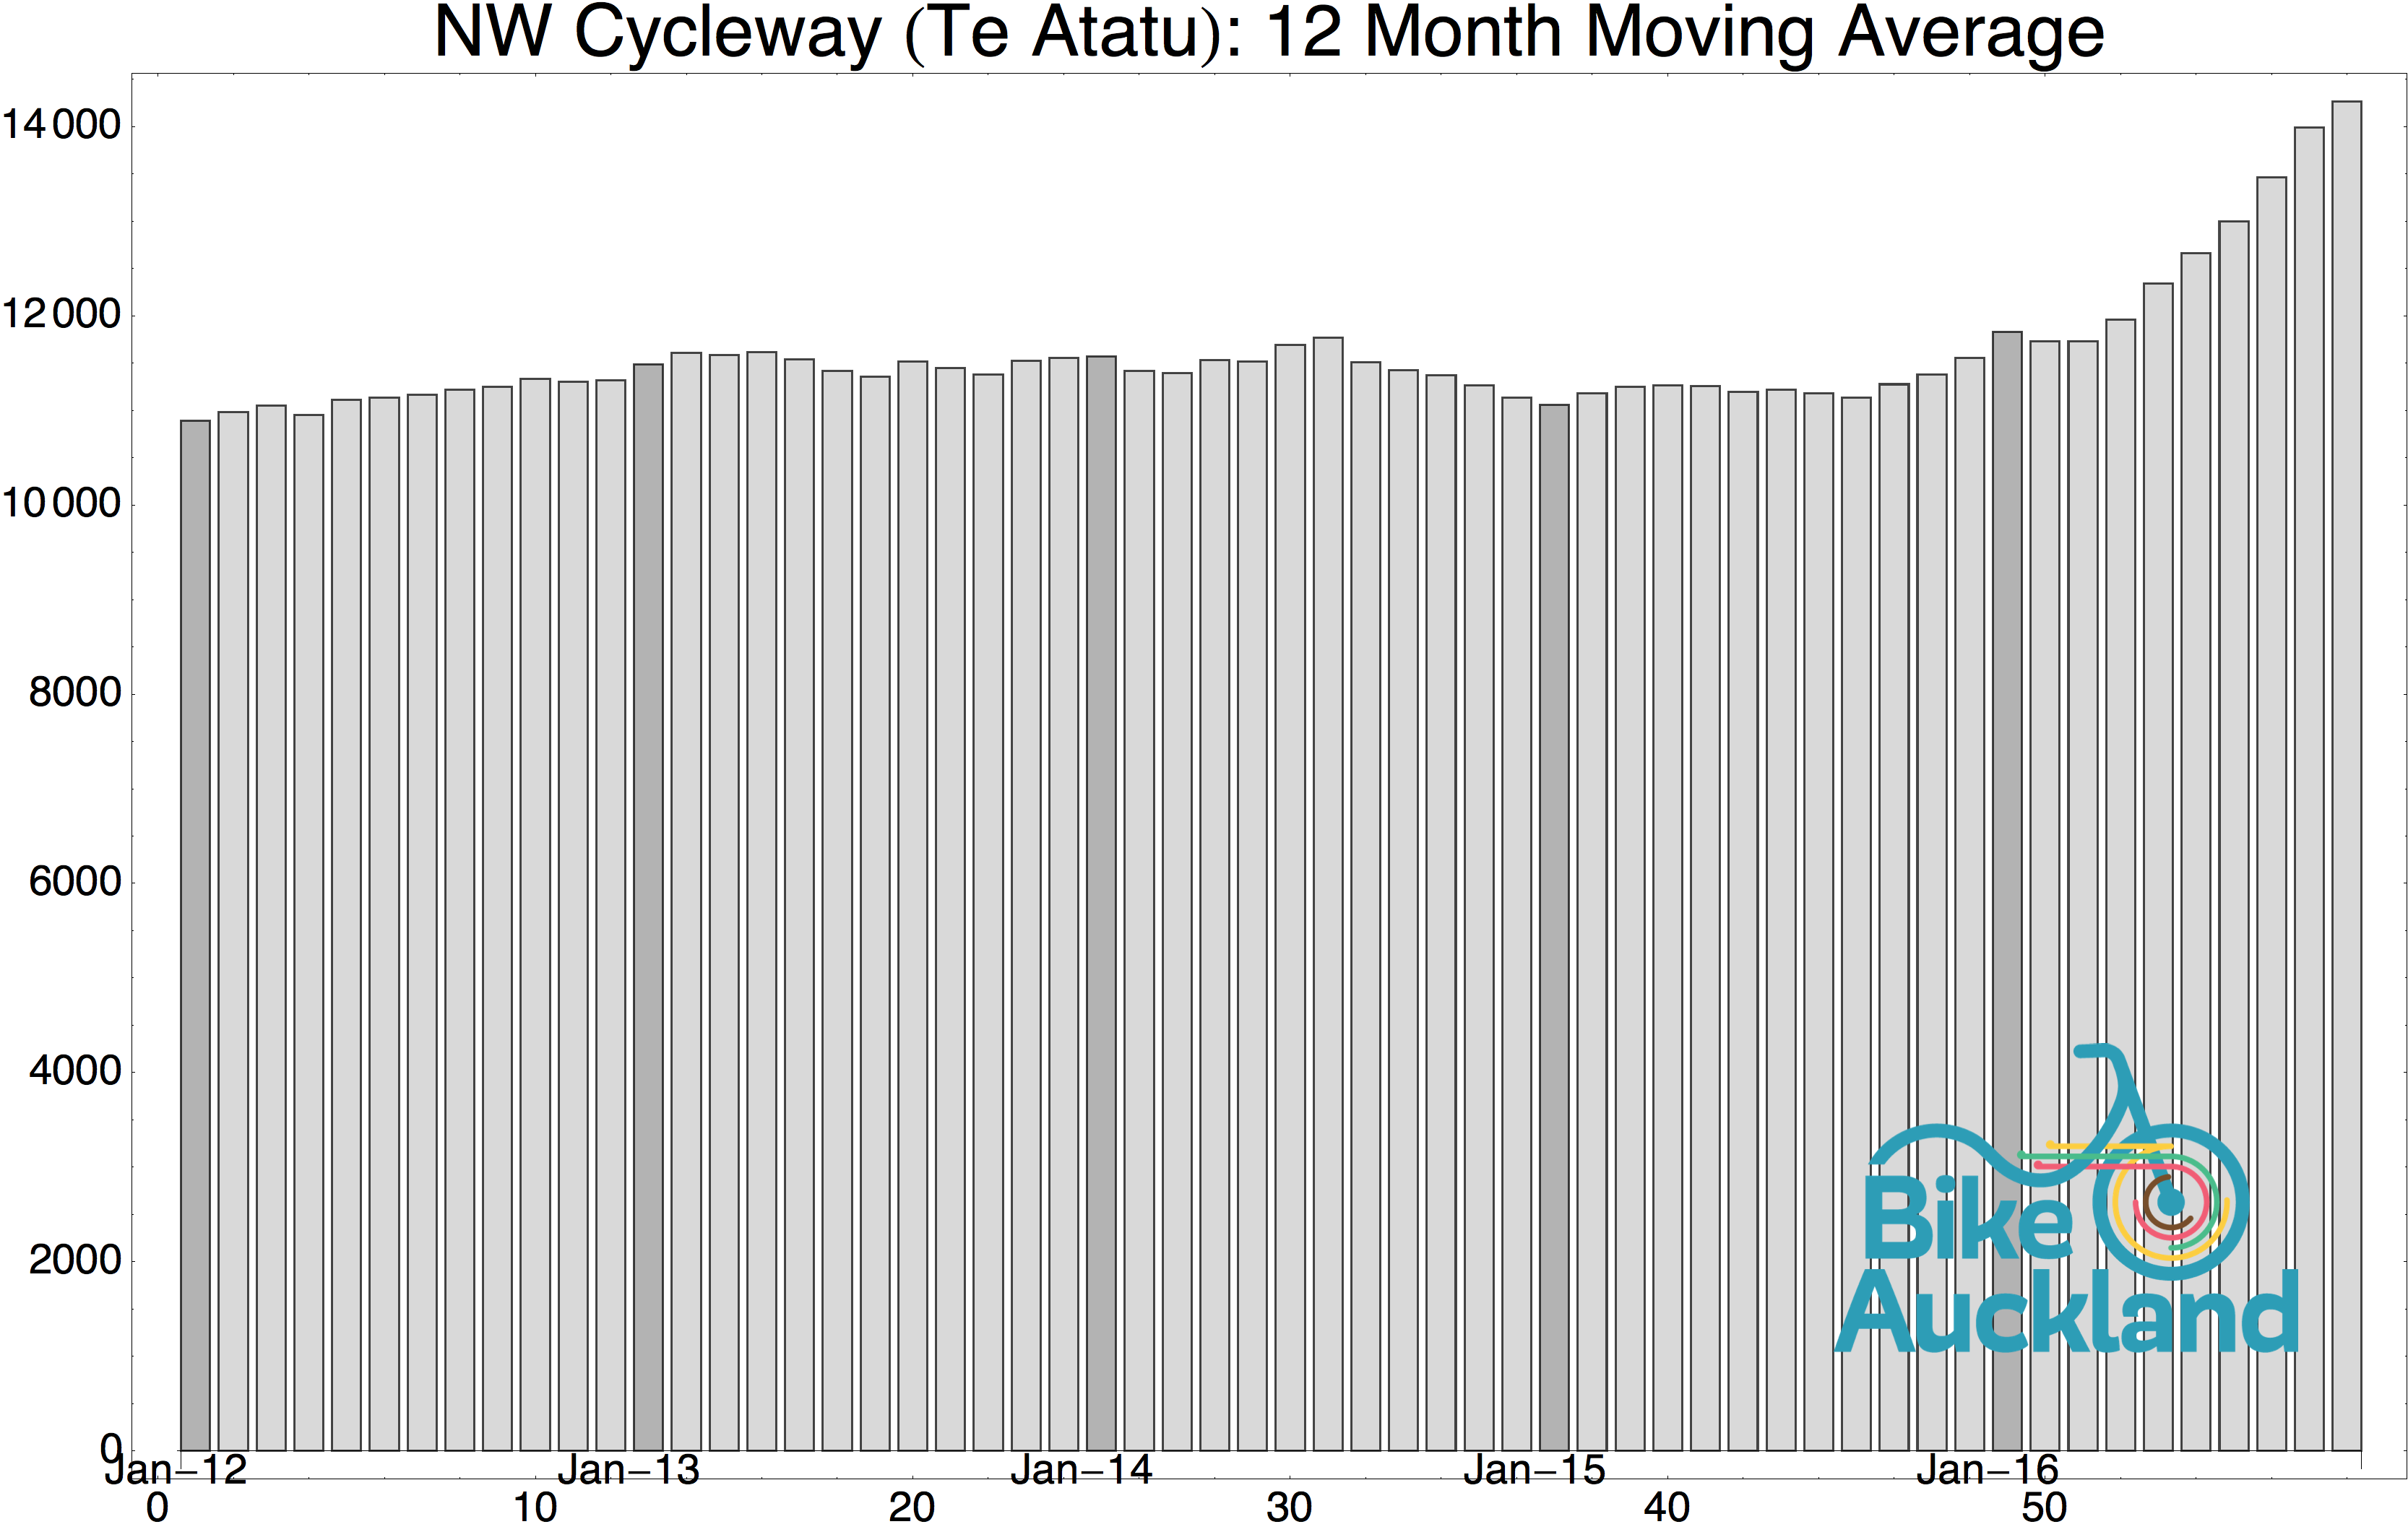
First, Te Atatu, which is experiencing the fruits of the recently completed and improved causeway cycleway. Can you say ‘up-tick’? That 12 month total looks a bit like a rocket launch!

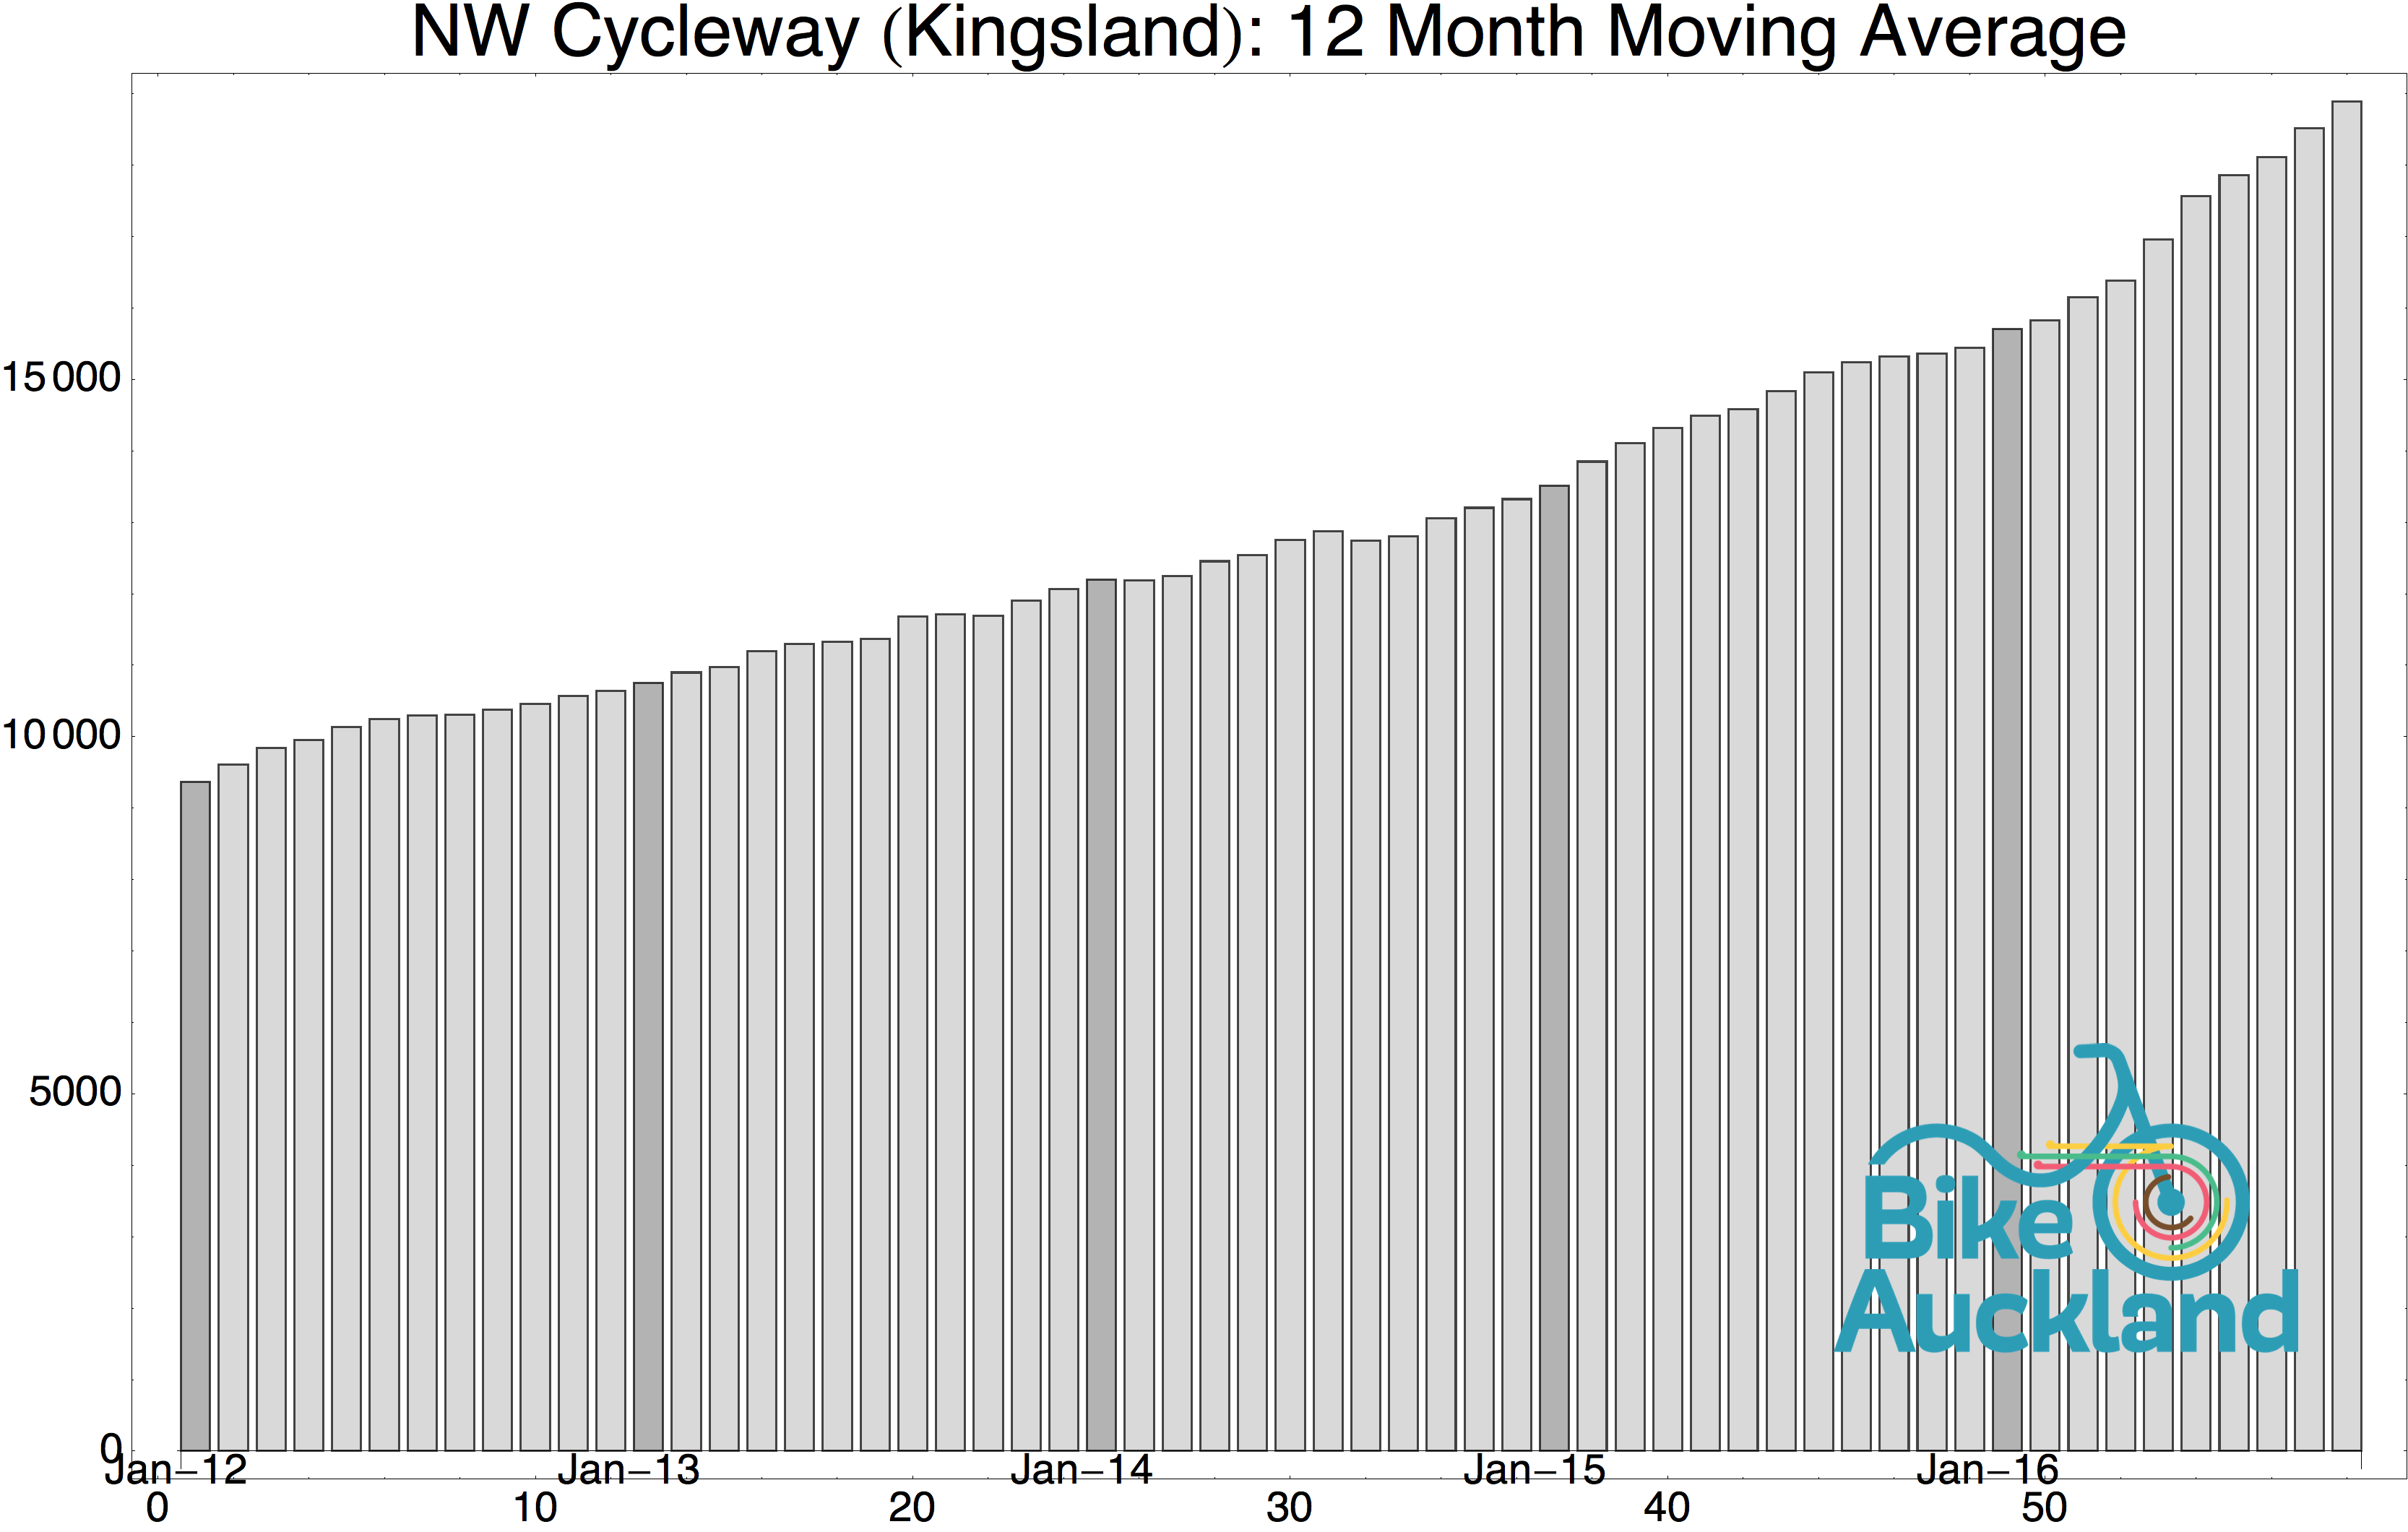
And then Kingsland, closer to town on the older part of the NW Cycleway, where the rise upon rise continues. It’s like a global temperature rise chart, but in a good way. Pretty soon we’ll crack a month with over a thousand average users daily! This coming summer? Bring it on.


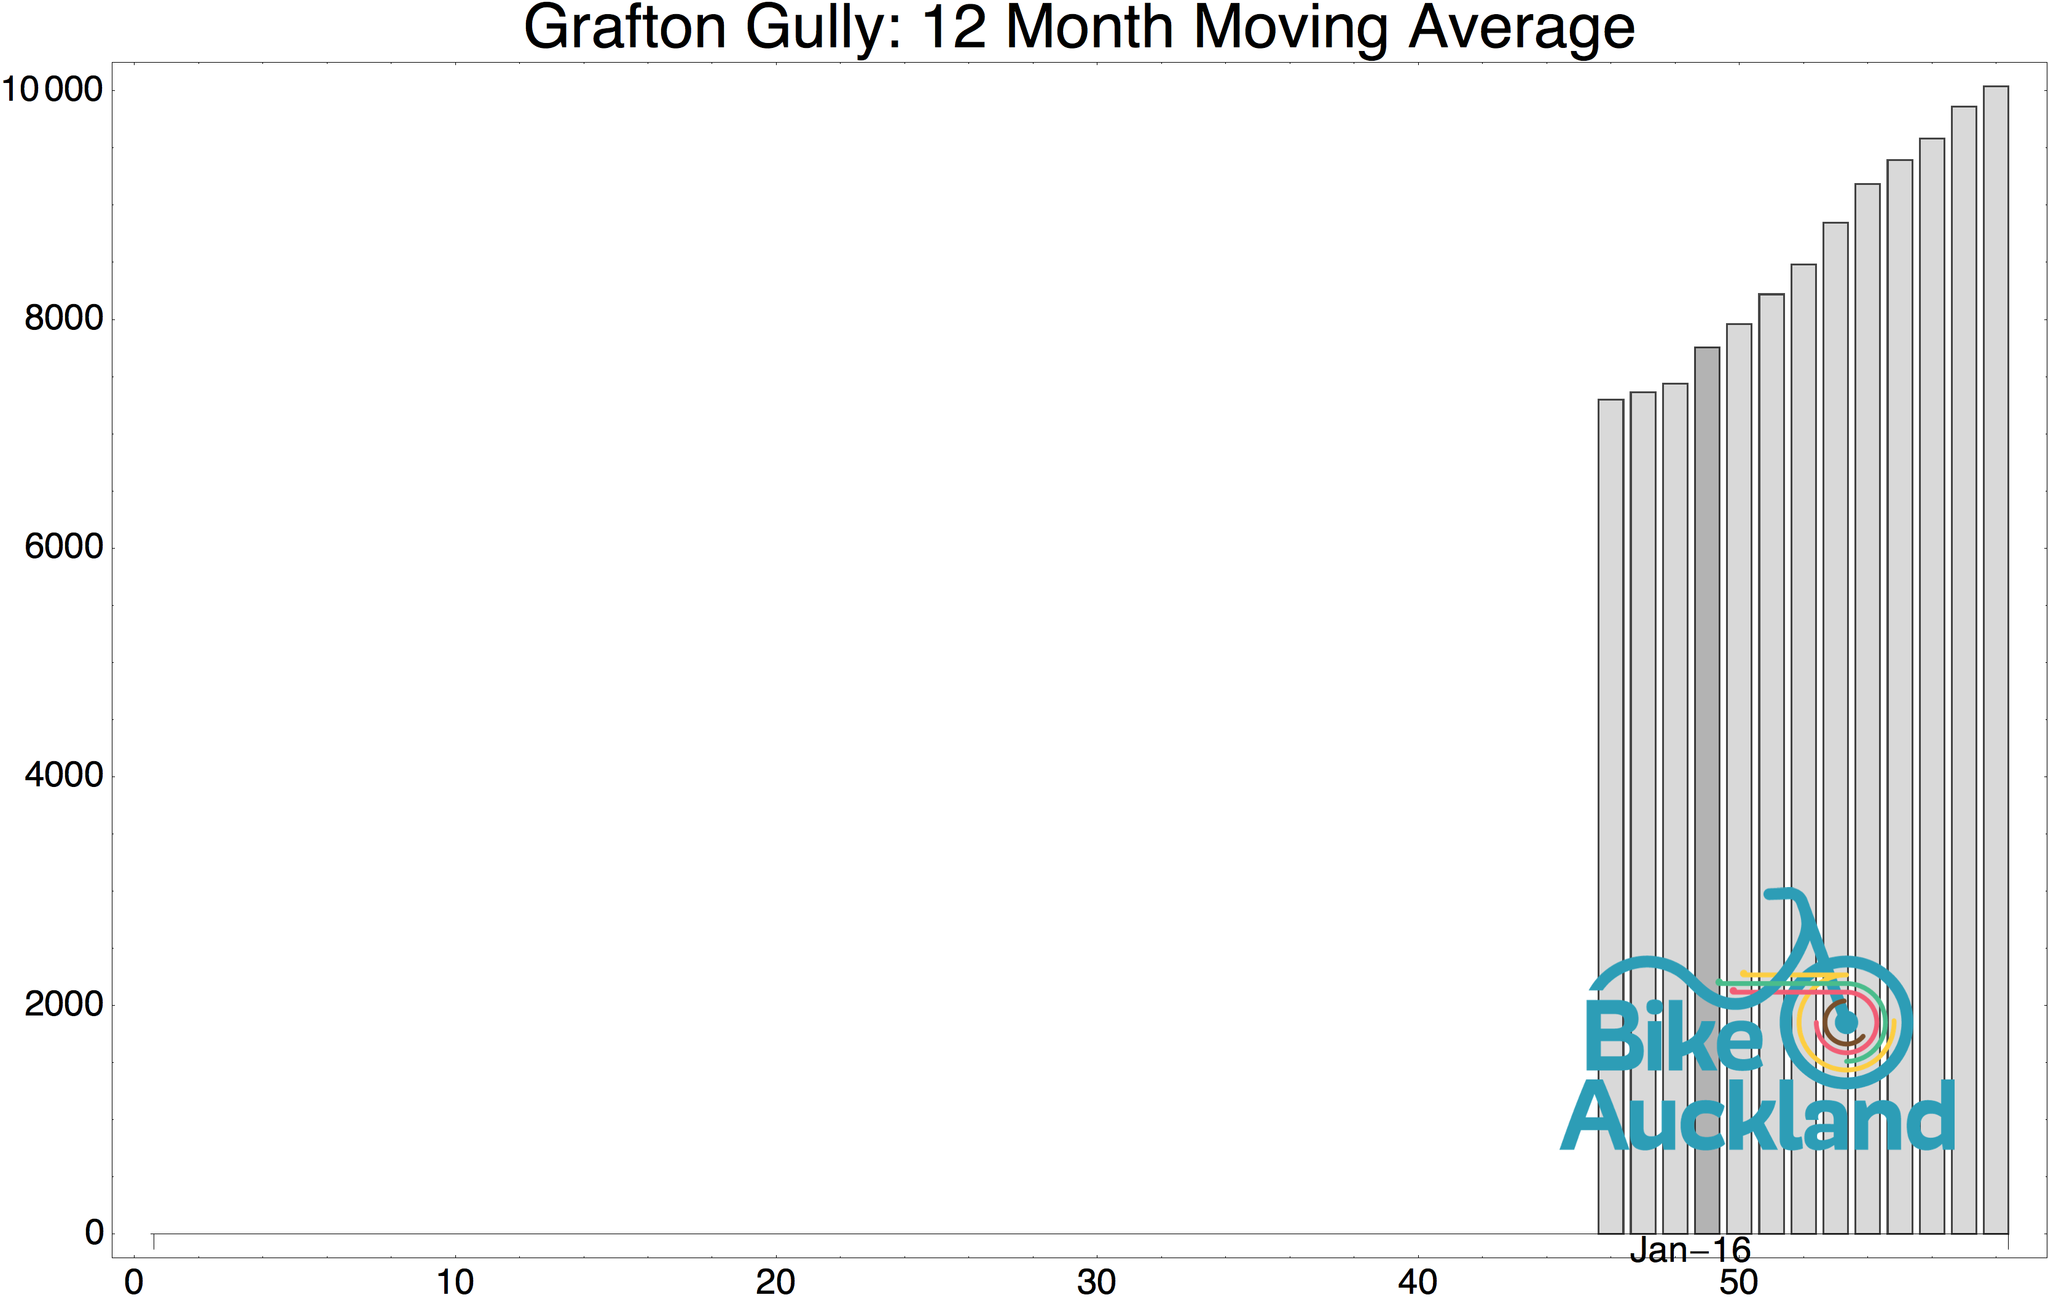
Now check out the comparison between a few inner-city routes. K Rd is a popular ridge route; Symonds St and Grafton Gully parallel each other, although Symonds has more local connections and doesn’t involve sacrificing height, while Grafton Gully snakes down into town with offshoots uphill into the university.
There are similar amounts of bike traffic on all three, but look where the growth is happening. As you can see, the off-road Grafton Gully, while rising dramatically, isn’t siphoning off Symonds St bike traffic – although we know from other surveys that it is attracting more people who are new to cycling.


These ‘three sisters’ form a fable of sorts. Bus-dominated (and over-sized vehicle route) Symonds St has been an important bike route to town – and a constant target of pleas for safety improvements – since at least the 1970s. Despite the lack of facilities, the hard core continues to ride this route, because it’s convenient and connected – and none of us is letting go of the potential for better bike infrastructure here, even if AT seems inclined to wait until after sorting out CRL and Light Rail.
The Grafton Gully Cycleway, which essentially arrived gift-wrapped from NZTA (a model for retroactively threading cycleways through the city), provides a smooth direct off-road link into the CBD. Although steep in parts and short on street-front connections, it continues to draw new riders every month. It’s reached Symonds Street levels in barely over a year.
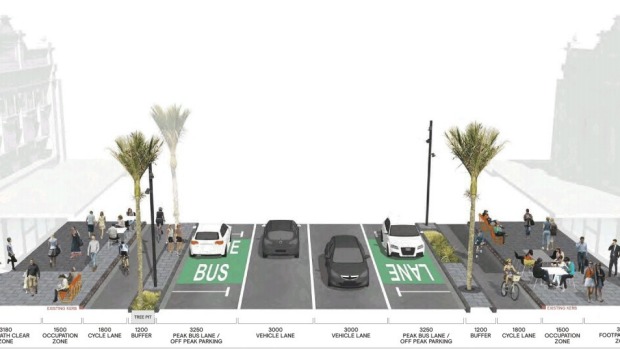
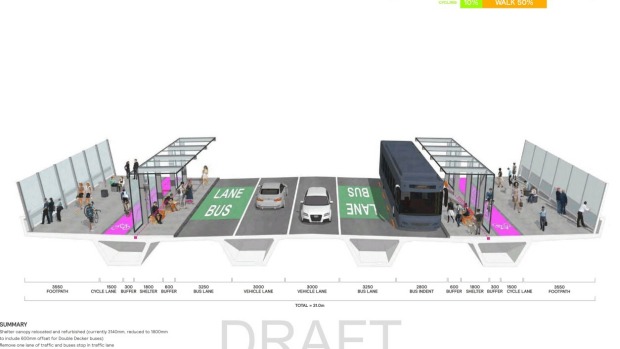
Meanwhile, Karangahape Rd is steady – but is also about to consult on a really exciting new upgrade. Which encompasses all kinds of traffic, especially the foot traffic that gives the street its vibrancy, and the expected growth in public transport as the CRL is constructed – with bikes as a key part of the picture.
Stay tuned for specifics when public consultation opens, but we can tell you it’s a result to be proud of, created via fabulous teamwork – as the following glimpses show. (More info here). And once K Road comes on-stream, not only will it take off, but so will all the linked streets and cycleways. Connect the dots.