

Remember when Auckland had a paltry $5 million across 3 years to spend on all improvements for walking AND cycling across the entire city? Us neither! Those bad old days seem eons ago – yet it was only in 2015 that the Urban Cycleways Programme (UCP) unlocked extra funding and kickstarted the bike boom, the effects of which we’re just starting to see.
 Now, Auckland Transport along with the NZ Transport Agency and Auckland Council, is looking a decade into the future with an investment business case for cycling investment 2018-2028. Yesterday, the AT Board formally approved it.
The guts: a proposed combined investment of $600million over the next 10 years to build 150km of bike network and raise the proportion of people cycling to 5% – with an additional $35 million invested in complementary initiatives over the same period (we’ll get to that bit later).
At $63.5m a year, it would effectively lock in the current rate of UCP-bolstered spending. Obviously, the goal could be delivered even faster if the funding increased – or slower or not at all, if funding were to slow down or disappear. But as a recommended target, it’s simultaneously quite reasonable and quite ambitious.
And to anyone who happened to be reading this from a few years in the past, it’s mind-blowing!
So what – and where – would it deliver? Let’s dig in…
Here’s the overview of the programme: not only the overall budget, but the areas targeted for early construction and those for later. We’ll get to how those were decided in a minute.

First, a snapshot of where we’re at. Some huge jumps in bike travel at key junctions and routes on connected cycleways; a bunch of newbies out there giving it a go.
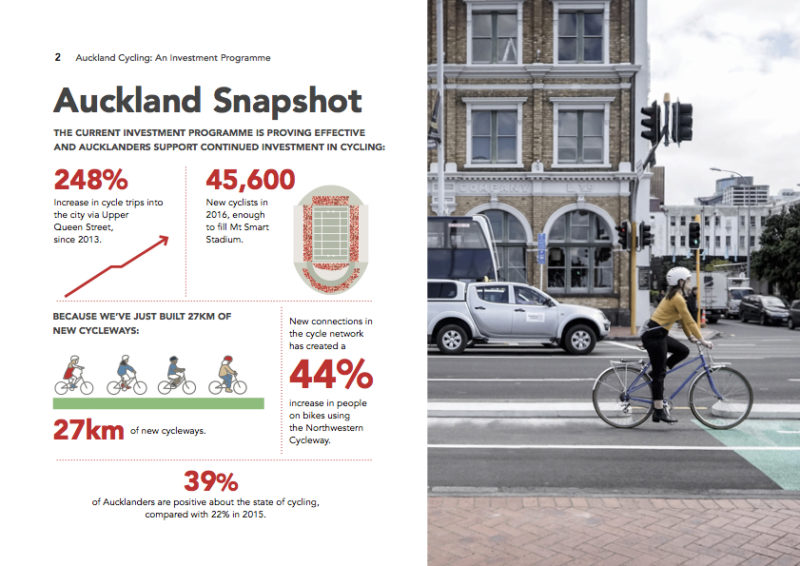
Sure, it’s a glowing snapshot, designed to highlight successes – we all know that cycling has tended to stay flat in the parts of town that haven’t seen any investment, and that commuter cycleways are brilliant but don’t necessarily make it easier for local trips to shops and schools – but it primes us to consider the opportunity for further growth.
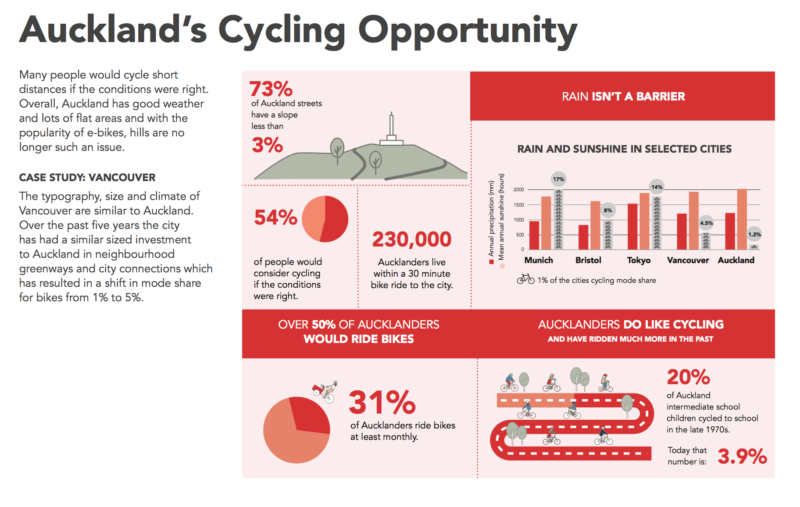 Instant takeaways from this page: one in three of us rides at least monthly – so we know how to do it. Our city is not as hilly as you think, and no less sunny or rainy than comparable cities which have higher rates of cycling. (Vancouver is an excellent analogue – and they’ve invested similarly over the last five years, to bring their cycling share up from around 1% to 5% in the City of Vancouver).

Moving right along… where are the really big opportunities? Here’s one: nearly quarter of a million people within cooee of the CBD (a sixth of all Aucklanders), where there are nearly quarter of a million jobs (a third of all jobs). That’s quite amazing. And this doesn’t include those who’ll be within a 30 min ride + ferry, or who’ll be within cooee of the CBD once SkyPath opens. (There’s no mention of SkyPath in the business case, which is curious).

This next one, to our mind, is the winning graphic. It’s a beautifully detailed update of our famous cycling catchment map, and captures the number of Aucklanders who live within a 15 minute bike ride of ferry terminals, and train and bus stations on the Rapid Transport Network.
We’re talking about half the population. Half. Of. Auckland.
(Note: this doesn’t even include local bus stops and local routes).
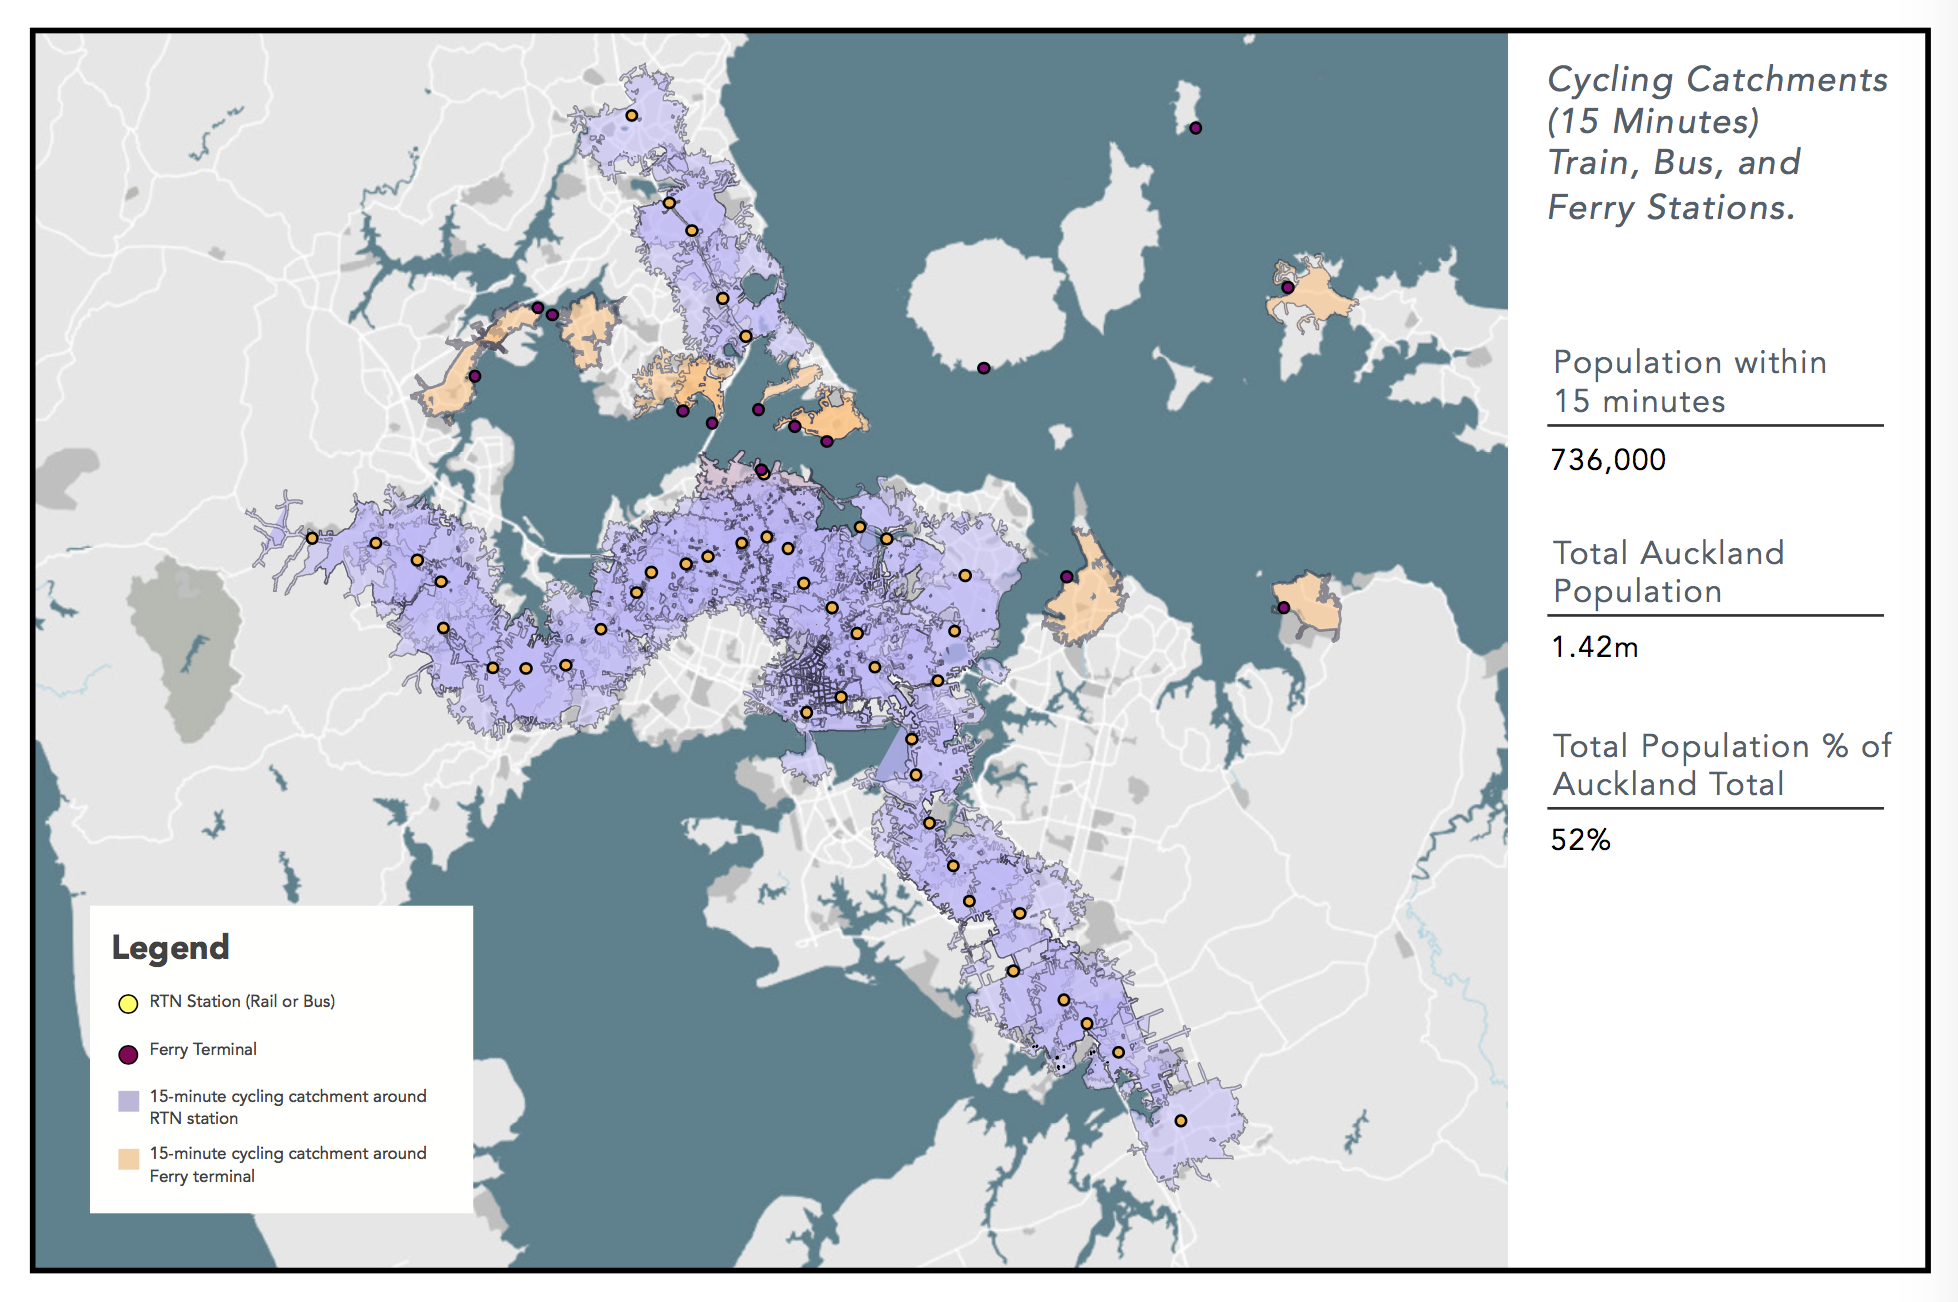
You’ll notice a few gaps on the PT map. The airport, for example. The southern section of the isthmus. Most of east Auckland, the Upper Harbour, and tracts of the Shore. Some of those are covered in the proposed areas for investment, perhaps because there’s local cycleway investment (e.g. Glen Innes, Mangere) or perhaps a strong local bike culture and huge potential for mode shift (holla, Te Atatu!).
Let’s take a closer look at those areas for investment. At first glance, the North Shore looks a bit underloved; the Northern Corridor Improvements, which go before the Board of Inquiry next week, would surely invite some joined-up thinking. Ditto East Auckland. But you have to start somewhere, right?

Here’s how the priority areas were arrived at.

Note the nifty graphic of key stakeholders, lower left – the funders and builders deep in discussion; the lady in red gazing into the future and ready to ride… We know how she feels, while sympathizing with the hard calls that go into prioritizing one part of town over another.
We will say, the analysis seems pretty rigorous to us, although it diverges from some of our Bike Blueprint priorities. The ‘Bermuda Triangle’, for example, the glaring gap in the network along SH1 from Newmarket south, appears to be in the ‘build later’ category.
The way to fix that would be to up the budget and the capacity for delivery, which is a matter of political will. Will it depend on how the election goes? Maybe – but it mainly depends on political leadership, and on a clear mandate from the public. If we want more cycleways and safer streets faster, we’re going to have to raise our voices.
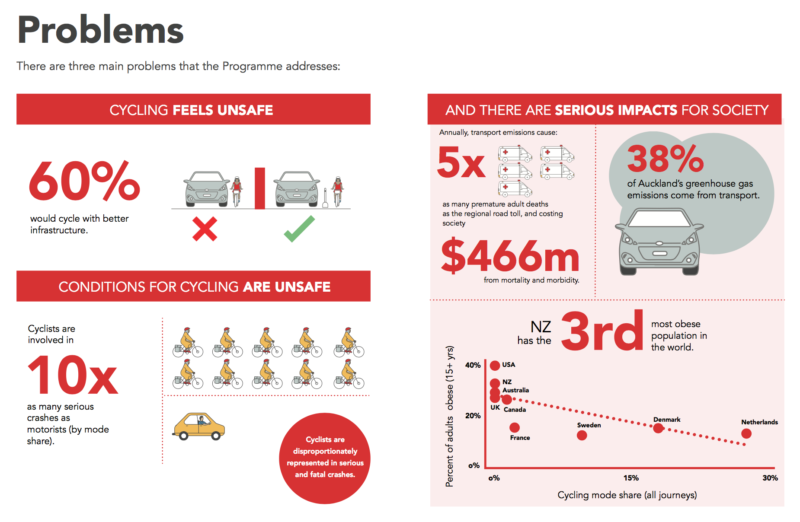
Not convinced by all the positives? Look at the negatives. Having unsafe streets for cycling is costing us in actual harm and foregone benefits. Making it easier for kids and adults to travel by bike will address these costs sooner rather than later. It’s a bit like climate change: we can keep denying if we like – but the data will keep coming, whether we like it or not. So when are we going to act? How about now?
Back to the positive: here’s what success would look like. Healthier, happier communities; free-moving streets with travel options for all; more money in people’s pockets.
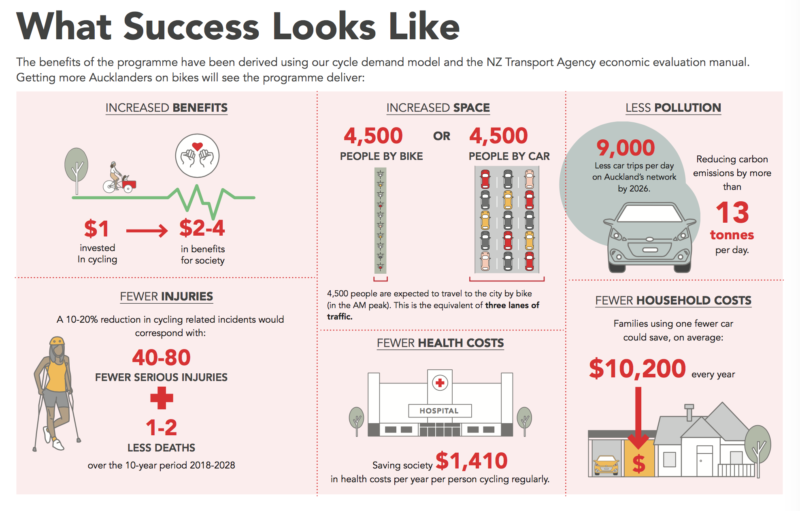
One thing missing from the graphic above is what success would literally look like. We think about this a lot – it’s what drives what we do, more than statistics and maps. Cycling cities aren’t just good for you, they’re good-looking too: prettier, and sexier. It’s a fact.
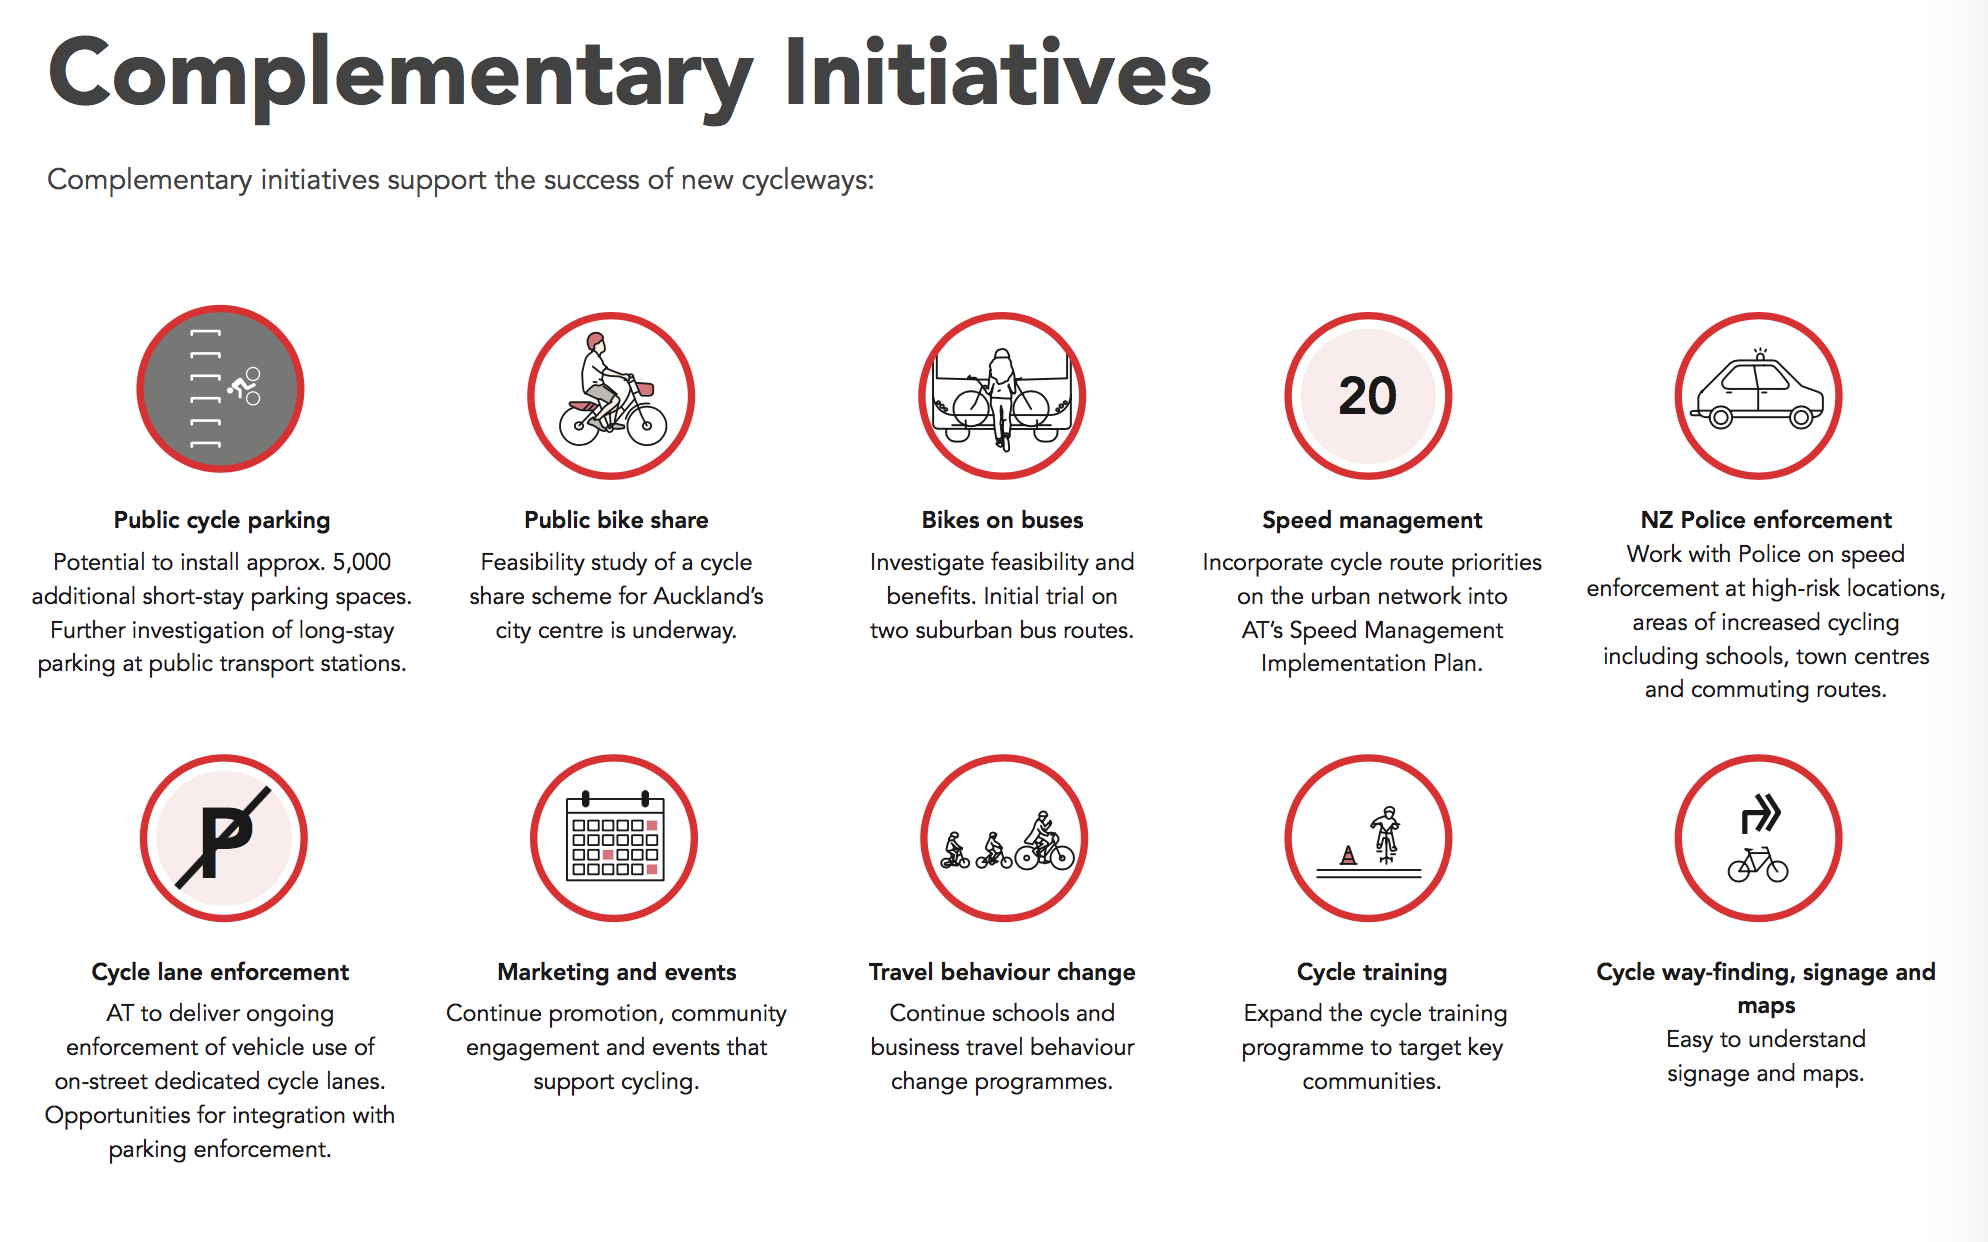
Oh, and those ‘complementary initiatives’? Here they are. Speed and bike lane enforcement, events, more bike parking, better signage, bike training, bike-wise school and business programmes, slower speed zones and the feasibility study for public bike share… And look! A bikes-on-buses trial!
Where to from here?
The next stage in the formal process is to feed this Cycling Programme Business Case into the Integrated Transport Planning calculator, where it will be weighed up against other transport priorities; and then indicative and detailed business cases would follow before specific projects get underway.
Of course, the other next stage in the process is for people to speak up loudly in support of this level of ambition – and whether it could be even more ambitious! If you’re feeling moved to action, please join us so together we can hold this document to its promise.
Here’s the document (preceded by a report from the AT Board). Share your thoughts and questions below. What do you reckon? Are we getting there at last?
Header image: a still from Bike Te Atatu’s brilliant ‘Futurementary’, which dares to imagine the outcome of exactly this kind of investment. Watch it, and wonder!


